


Bitcoin is struggling as the price tests $62,000 as support — a level that would represent a significant extension of the correction from the cycle highs and a test of the structural foundation that bulls have been pointing to throughout the decline. The weakness is real and the selling pressure is persistent — and XWIN Research Japan has published an analysis that cuts through the competing macro narratives to identify what the on-chain data suggests is the actual driver of the current correction.
Related Reading
There are many explanations floating around the market, from geopolitical conflicts to Federal Reserve policy and Strategy’s latest small Bitcoin sale. XWIN Research Japan CryptoQuant’s analysis points to a simple, yet fundamental reason: the buyers have disappeared.
It was not leverage or retail momentum nor speculative overspending that drove Bitcoin’s rally from 2024-2025. It was consistent and sustained inflows into US spot Bitcoin ETFs — a structural demand source that absorbed supply methodically and provided the bid that supported progressively higher prices. The engine reversed in 2026. ETF withdrawals increased, while Coinbase Premium was negative for a prolonged period. US Institutional Demand, which is the longest-lasting and largest category of buyers the market has seen, confirmed that they have withdrawn their active acquisition.
Bitcoin Coinbase Premium Gap | Source: CryptoQuant
The Realized Cap data quantifies its impact. Bitcoin’s Realized Cap declined from approximately $1.12 trillion to $1.08 trillion — a reduction that represents nearly $40 billion of capital Leaving the network. If the indicator that shows actual invested capital drops by this magnitude, then the market isn’t experiencing a mood correction. This is a true withdrawal in demand.
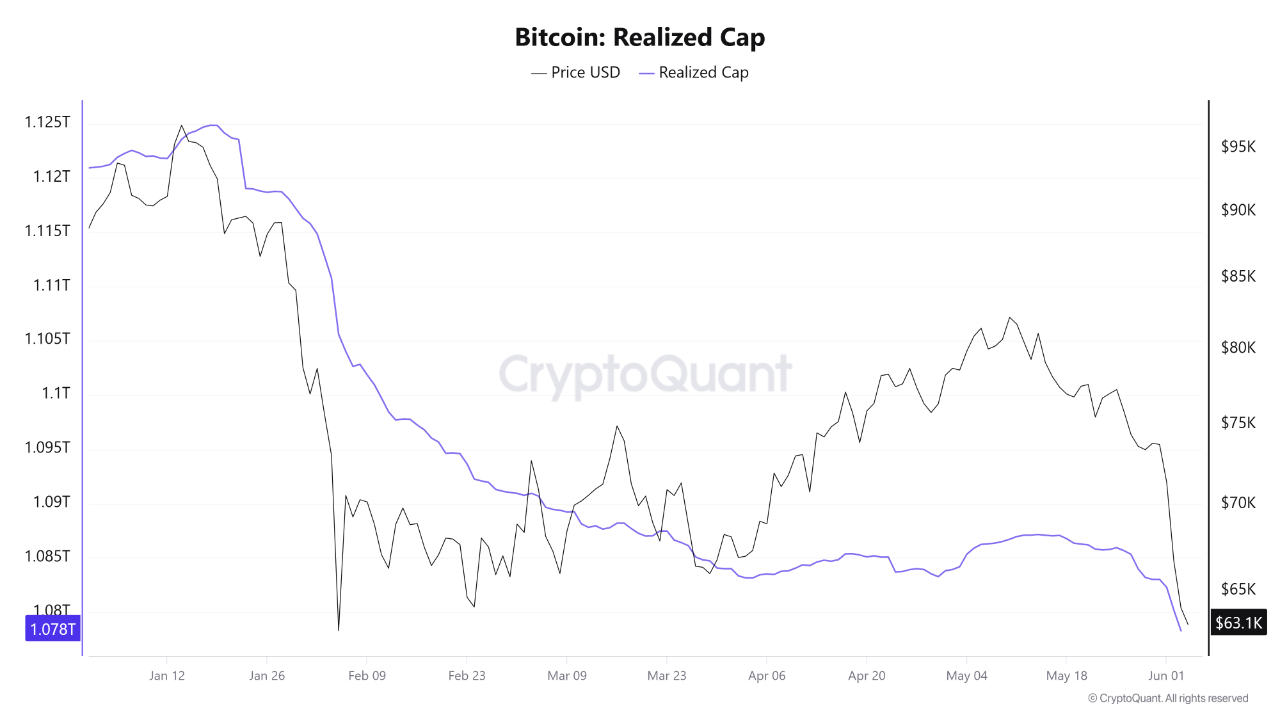
Bitcoin Realized Cap Source:| Source: CryptoQuant
The Network Left 40 Billion Dollars
The XWIN Research Japan analysis This graph shows the path that capital took after Bitcoin. US equities — particularly AI-related companies delivering strong earnings growth, executing aggressive share buyback programs, and driving the S&P 500 to record highs — presented a competing allocation that many institutions found more immediately compelling than Bitcoin in the current rate environment. The capital did not disappear. The capital was invested in assets that had a visible growth rate and catalysts for near-term success, which Bitcoin’s structure of liquidity dependence cannot match.
Futures markets accelerated the decline in prices without actually causing them. The Open Interest fell sharply. Funding rates normalized. And more than 150 million dollars in leveraged positions liquidated from June 3 to June 4 were a result of the drop. Those liquidations were a consequence of weakening demand rather than its origin — derivatives unwinding into a market already lacking the spot bid needed to absorb forced selling.
Most of the analysis’s reassurance comes from the comparison between 2022 and today. The long-term investors are still largely intact. Balances of exchange are at a historically low level. Current corrections do not reflect the excess supply caused by panic that characterised the collapse in the previous cycle. Problem isn’t too much sales. The problem is not too much selling, but rather too little purchasing.
Specific conditions are identified in the report. ETF flows returning to positive territory, the Coinbase Premium recovering above zero, Realized Cap resuming growth, and capital concentration in AI stocks beginning to slow — these are the signals that would confirm demand is returning rather than rotating further away. Demand was behind June’s correction. Next major Bitcoin trends will be decided by the same forces that caused them.
Related Reading
Bitcoin Hangs on to $62K as Breakdown Reaches Critical Support
Bitcoin continues to be under extreme pressure. A violent selloff has erased the April-May rally and forced the price into the same zone of support that marked the capitulation bottom in February. BTC is trading at $62,500 on the daily chart after briefly dropping to $61,000. This puts the market right in the middle of the biggest demand zone for the year.
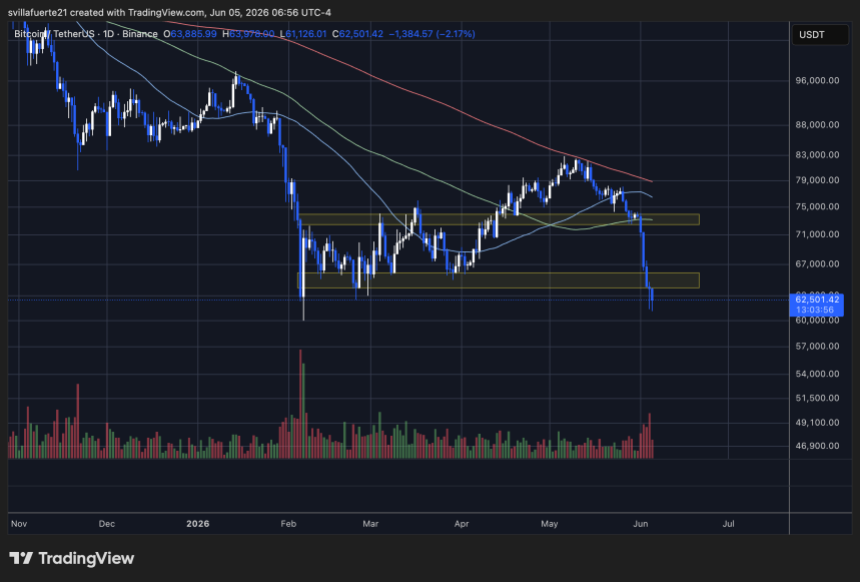
Source:| Source: BTCUSDT chart on TradingView
The technical structure of the Bitcoin has significantly deteriorated. Bitcoin lost its $72,000 to $74,000 support area that was a pivotal point in April and May. The area that was support has become resistance. It is the first big obstacle in case a relief rally occurs. The breakdown was accompanied by an increasing volume of trading, which suggests that the movement is driven more by aggressive sellers than temporary liquidity shortages.
Related Reading
Market is currently testing February’s bottom near $61,000-$64,000. This support, unlike previous pullbacks is now being tested after a series of lower highs & lower lows. Confirming a bearish market across all daily timeframes. BTC remains also below the 100-day and 200-day average moving prices, which reinforces the seller’s dominance.
This area has a historical importance. In the end, February’s capitulation marked the start of a multiple-month recovery. Bitcoin may attempt to stabilize if buyers protect the zone. If the support level fails to hold, then the next target is the psychological $60,000. Next, it’s the region of the $50k+ range.
Chart from TradingView.com, image from ChatGPT
“This article is not financial advice.”
“Always do your own research before making any type of investment.”
“ItsDailyCrypto is not responsible for any activities you perform outside ItsDailyCrypto.”
Source: www.newsbtc.com


