


Bitcoin’s price movement has been exhilarating. But beyond all the buzz, there is a wealth on-chain information that offers deeper insights. Analyzing metrics to gauge investor sentiment, network activity and BTC’s market cycles can help us gain an understanding of Bitcoin’s position today and its potential future.
There is Still Plenty of Upside to be Had
The MVRV Z-Score Comparing Bitcoin’s Market Cap, or the price multiplied with the circulating supply of BTC, to its Realized Cap, is a comparison between their average prices at which BTC was last traded. In the past, the red zone of this indicator has signaled overheated market conditions, while a green zone signifies widespread losses and possible undervaluation.
Z-scores are currently neutral despite Bitcoin reaching new record highs. In previous bull runs, Z-scores reached highs between 7 and 10, which is far above the current Z-score of approximately 3. The Z-score is currently at around 3. If the past repeats itself this suggests that there’s still room for significant price increases.
Mining Profitability
The Puell Multiple Compare daily USD revenues to the previous moving average of one year. Miners’ profits dropped 50% after the halves, leading to lower earnings for several months as BTC prices stabilized throughout most of 2024.
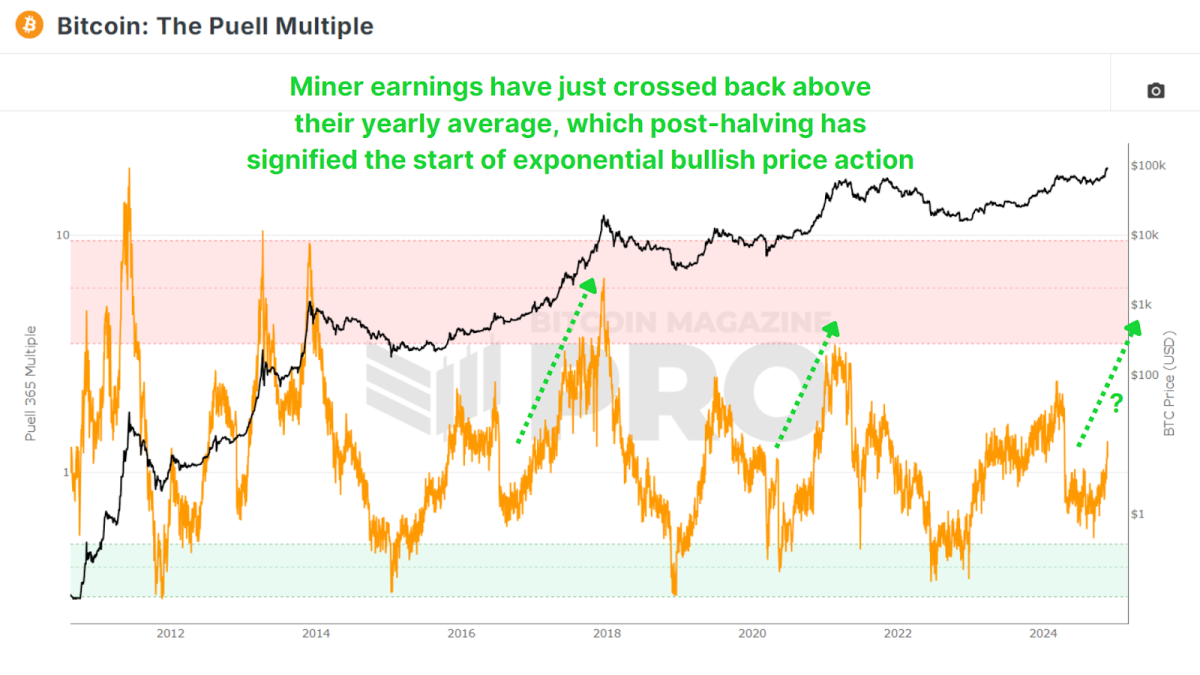
Even though Bitcoin is at new heights, this multiple only indicates a 30 percent increase in profit compared to the historical averages. The data suggests we’re still at the beginning to mid-stages of the bull run. When comparing patterns, we can see that the market is poised for explosive growth similar to what we saw in 2016 and 2020. The price has reached the phase of exponential growth after the reset of the halving.
Measurement of Market Sentiment
The Net Unrealized Profit and Loss (NUPL) The metric measures the overall network profitability by mapping out sentiments such as optimism, belief and euphoria. It is similar to MVRV Z-Score, which derives from the realized value of the investor or the cost-basis. This metric looks at current estimates for profit and loss by all stakeholders.

Presently, Bitcoin remains in the ‘Belief’ zone, far from ‘Euphoria’ or ‘Greed’. The data is consistent with the idea that there are still many opportunities for price growth before the market reaches saturation. This is particularly true considering that the metric still remains lower than it was in March, when we reached our previous record high.
The Long-Term Trends of Holders
This is the percentage of Bitcoins that have been held over an entire year. 1+ Year HODL WaveThe price of Bitcoin remains high, at 64%. This is higher than any time in the history of Bitcoin prior to this cycle. As long-term investors began realizing profits, prior price peaks of 2017 and 2021 fell to 40 and 53 percent respectively. In the event that something similar occurs during this current cycle, we would still have many millions of bitcoins to transfer to market participants.
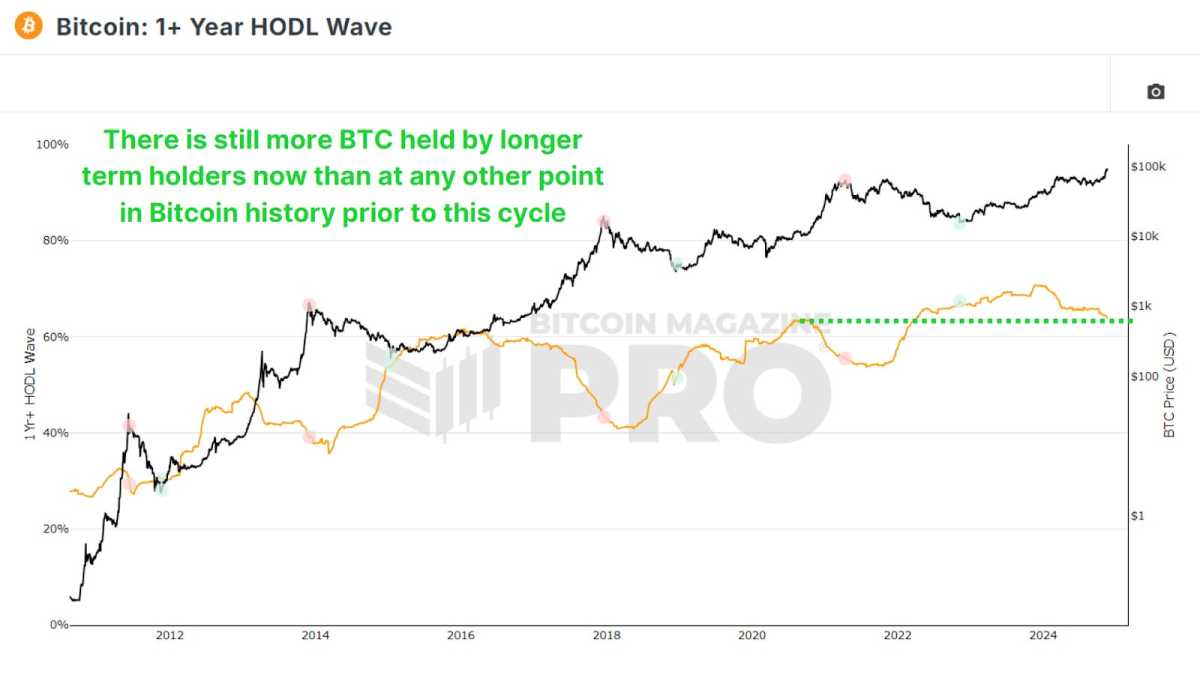
Only 800 BTC worth of Bitcoins have been sent from the Long Term Holder Supply Newer market participants are expected to participate in this cycle. In past cycles, up to 2–4 million BTC changed hands, highlighting that long-term holders have yet to cash out fully. The current bull market is still in its early stages.

Tracking “Smart Money”
You can also find out more about the following: Coin Days Destroyed This metric emphasizes whale activity by weighing transactions based on the duration that coins are held. Then we can multiply this value by the BTC rate at the time in order to determine the Value Days Destroyed (VDD) Multiple. It gives us an insight as to whether or not the most experienced and intelligent BTC holders have begun realizing profits from their BTC holdings.

The current levels are far below the “red zones” that typically occur during peak markets. Whales are a concern. “smart money” The majority of investors are yet to sell significant parts of their stocks and still await higher prices in order to begin realizing profits.
You can also read our conclusion.
Bitcoin remains far from being overheated, despite the recent rally. The long-term investors remain mostly steadfast and indicaters like the MVRV-Z-score NUPL and Puell-Multiple all point to room for further growth. However, profit-taking by some market participants and the emergence of new players could signal that we are entering a mid- to late-cycle period, one which may last until 2025.
Investors should remain data-driven. FOMO-driven decisions can prove costly. Use tools such as the metrics mentioned above to help you guide your investment and analysis.
Check out this recent video on YouTube for a deeper look at the topic. What’s Happening On-chain: Bitcoin Update
“This article is not financial advice.”
“Always do your own research before making any type of investment.”
“ItsDailyCrypto is not responsible for any activities you perform outside ItsDailyCrypto.”
Source: bitcoinmagazine.com


