
With the help of years of historic data, we are able to identify patterns that have occurred in previous bull cycles. This allows us to make more accurate predictions regarding our current cycle. We dive deep into this analysis to determine the price at which Bitcoin will reach its next peak.
Pi Cycle
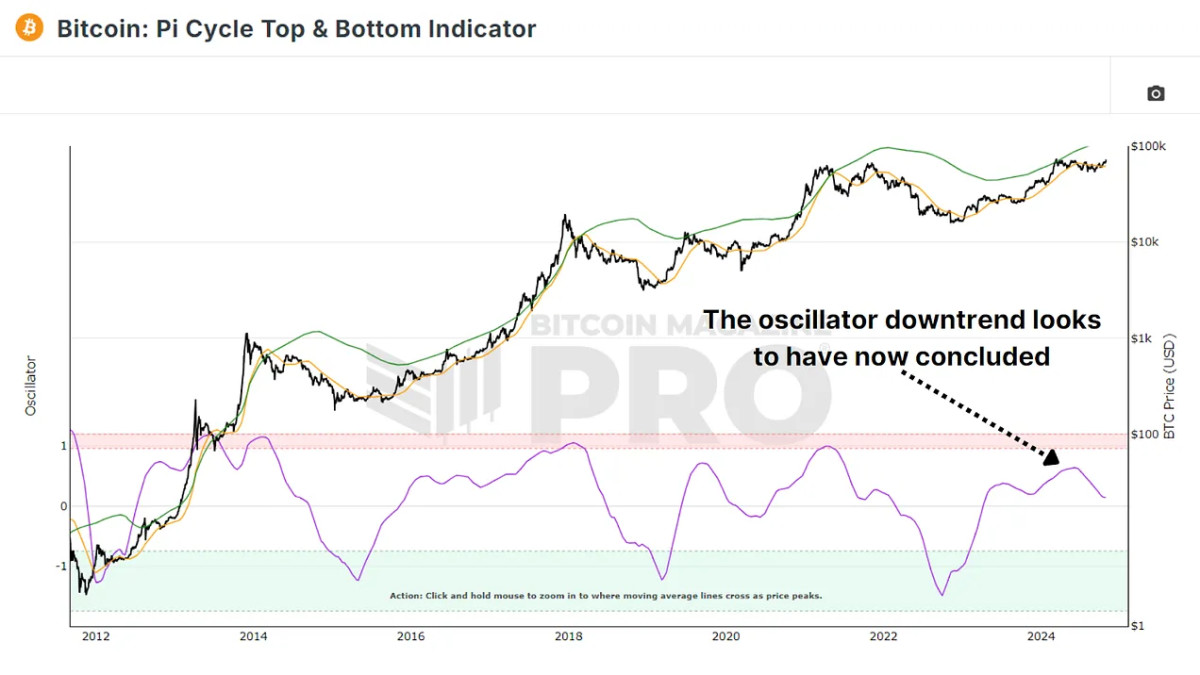
The Pi Cycle Top Indicator This is our most used tool for analysing Bitcoin’s cycle. This indicator is used to monitor the 350 day and 111 days moving averages (multiplied times 2), and it’s been proven that when they cross, Bitcoin reaches a high cycle within only a few short days. These two levels have been drifting apart for months due to sideways prices. We’ve only recently seen the 111 day trending up to close the gap.
With the help of the two-averages, we can better determine Bitcoin’s place within the bull and bear cycle. Pi Cycle Top & Bottom Indicator. This oscillator, which is trending upwards again, may indicate that Bitcoin’s bull run could be around the corner. It has parallels with previous cycles observed in 2016 or 2020.
Bitcoin cycles previous
Bitcoin cycles are characterized by similar phases. There is an initial surge, a cooling off period, another peak and then, finally, there’s a significant drop followed by new growth.
The 2016 cycle: This was a period of a bull market, followed by a peak and a dip. This is very similar to what we are currently experiencing. After these two retracements, Bitcoin reached new heights.
2020-2021 cycle: Although the pattern is less prominent, a similar trend was seen. Bitcoin’s value peaked two times, first during the initial upsurge and then again when BTC reached its all-time high.
We can use the Bitcoin Magazine Pro (API) to simulate growth scenarios using past cycles. We can use the Pi Cycle Top and Bottom Oscillator to overlay previous oscillators and see the potential path this cycle could take.

The 111-day average and the 350-day average may cross on June 29, 2025 if the cycle of 2021 repeats. This would indicate a possible Bitcoin peak. The moving averages may not cross until the 28th of January 2026 if the 2017 cycle mirrors. This would indicate a late peak.
Prices Projections
We can estimate future price levels using these dates. In the past, Bitcoin’s peak price was significantly higher than moving averages. Bitcoin’s peak price in 2017 was 3 times higher than the moving averages. As the markets mature, however, we have seen decreasing returns for each cycle. Therefore, Bitcoin’s prices might not be as dramatic as they were historically.
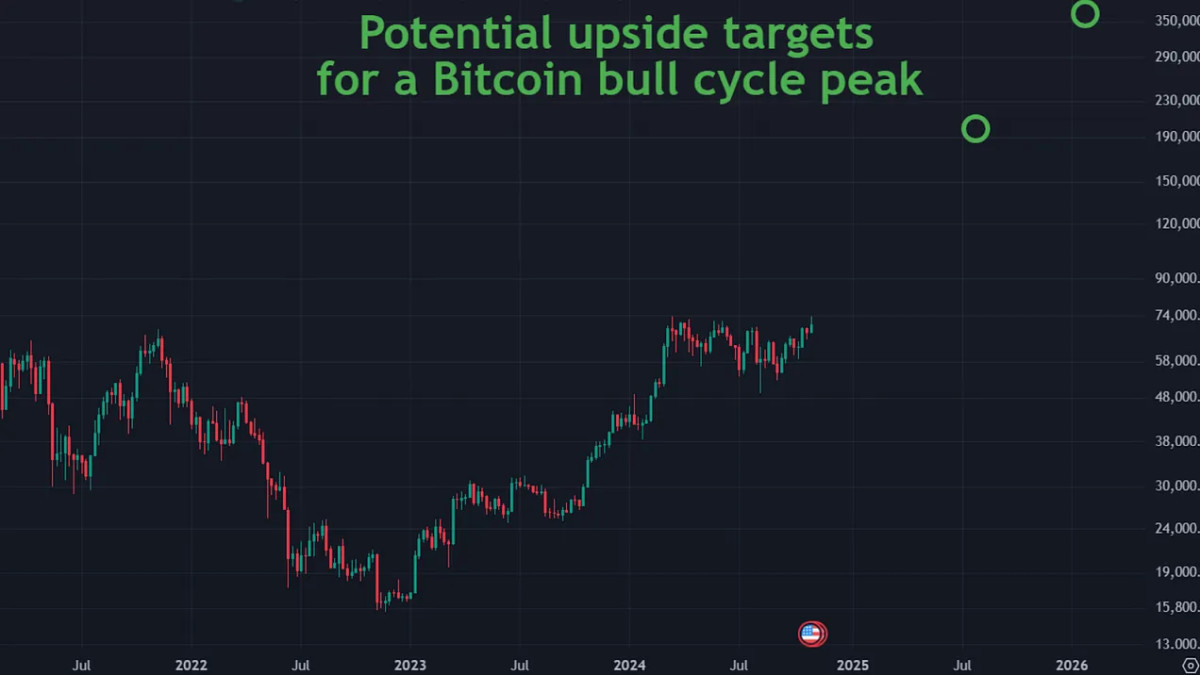
Bitcoin’s maximum would be approximately $339,000. Bitcoin could only grow 20% higher than the moving-averages, assuming diminishing returns. This would mean that the price of Bitcoin by mid-2025 could be close to $200,000.
If the extended 2017 cycle is repeated with decreasing returns, Bitcoin’s peak could be $466,000 by early 2026. A more moderate rise might lead to a price peak of about $388,000. Even though it is unlikely that Bitcoin will reach a million-dollar price in this cycle’s projection, the more moderated estimates could still result in substantial gains.
The conclusion of the article is:
These projections are based on well-researched data but they do not guarantee anything. Economic conditions, investor sentiment and regulatory changes influence the unique dynamics of each cycle. As Bitcoin matures, we can expect to see a decline in returns as well as a possible lengthening of cycles.
These tools will become more accurate as Bitcoin’s bull-cycle continues. This analysis provides you with potential outcomes that will help in risk management.
Check out this recent video on YouTube for a deeper look at the topic. Mathematically Predicting The Next Bitcoin All Time High
“This article is not financial advice.”
“Always do your own research before making any type of investment.”
“ItsDailyCrypto is not responsible for any activities you perform outside ItsDailyCrypto.”
Source: bitcoinmagazine.com