


Bitcoin price fluctuations dominate the headlines. But the true story behind BTC is hidden beneath the surface. On-chain data provides a unique view into supply, demand and investor behaviour in real time. These insights allow traders and investors to anticipate trends in the market, track institutional moves, and take data-driven decision.
Here is a video that will give you a closer look at this subject. Mastering Bitcoin On-Chain Data
Realized Price & MVRV Z-Score
On-chain data is the public record of transactions on Bitcoin’s Blockchain. Bitcoin transparency, unlike traditional markets where investors’ actions are hidden, allows real-time analyses of each transaction, wallet movements, and network activities. These data help investors to recognize major trends, zones of accumulation and price inflections.
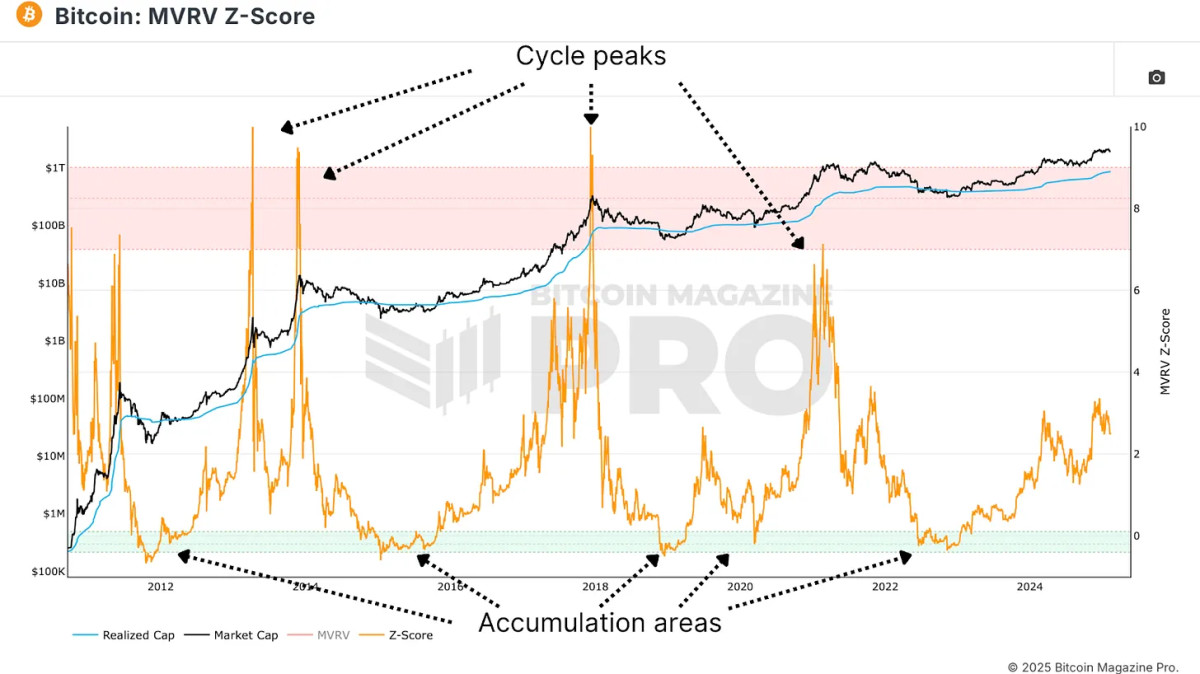
The most important on-chain metric is Realized PriceThis reflects the average price of BTC. Bitcoin allows real-time transparency into the profitability of all holders.
Analysts can use the Realized Price to enhance their utility. MVRV Z-ScoreThis indicator measures the difference between Bitcoin’s market price and its realized value. It is standardized to account for Bitcoin volatility. The indicator’s history has shown that it can identify optimal purchasing zones when the range is lower and overvaluations when the zone turns red.
Monitoring long-term holders
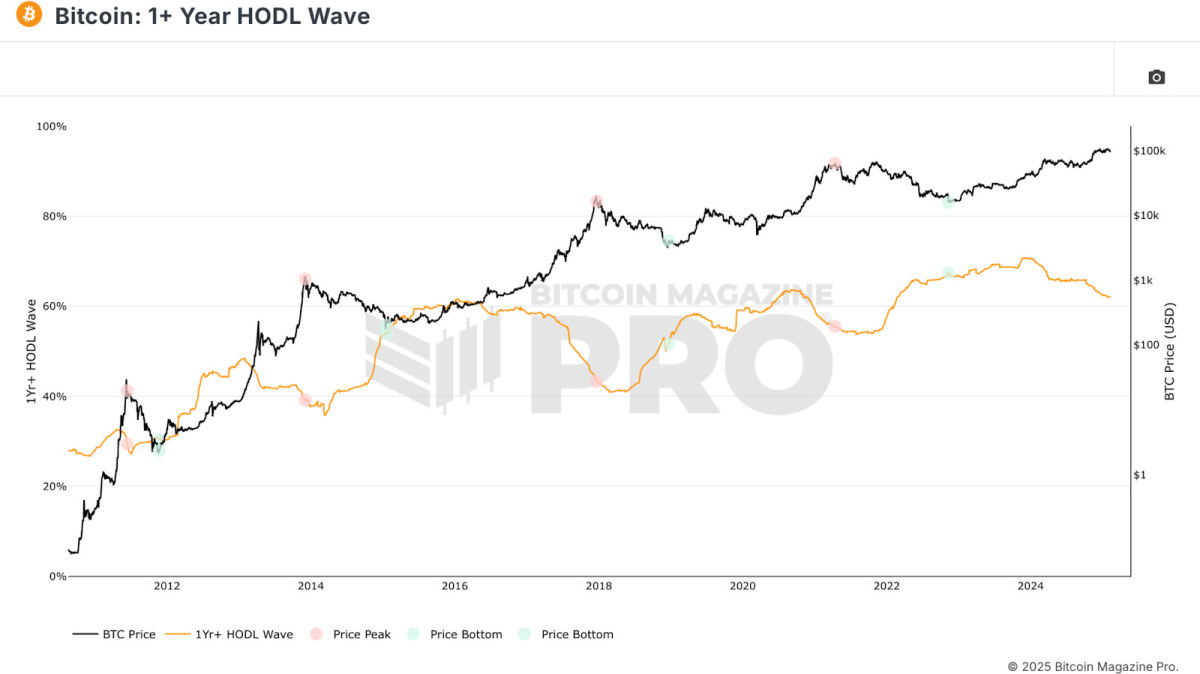
One key measure is the 1+ Year HODL WaveIt tracks Bitcoin addresses who haven’t received funds in at least 12 months. A growing HODL-wave indicates that investors choose to hold. This reduces the circulating supply, and creates upward pressure on prices. When this metric begins to decline, it indicates that investors are taking profits and distributing them.
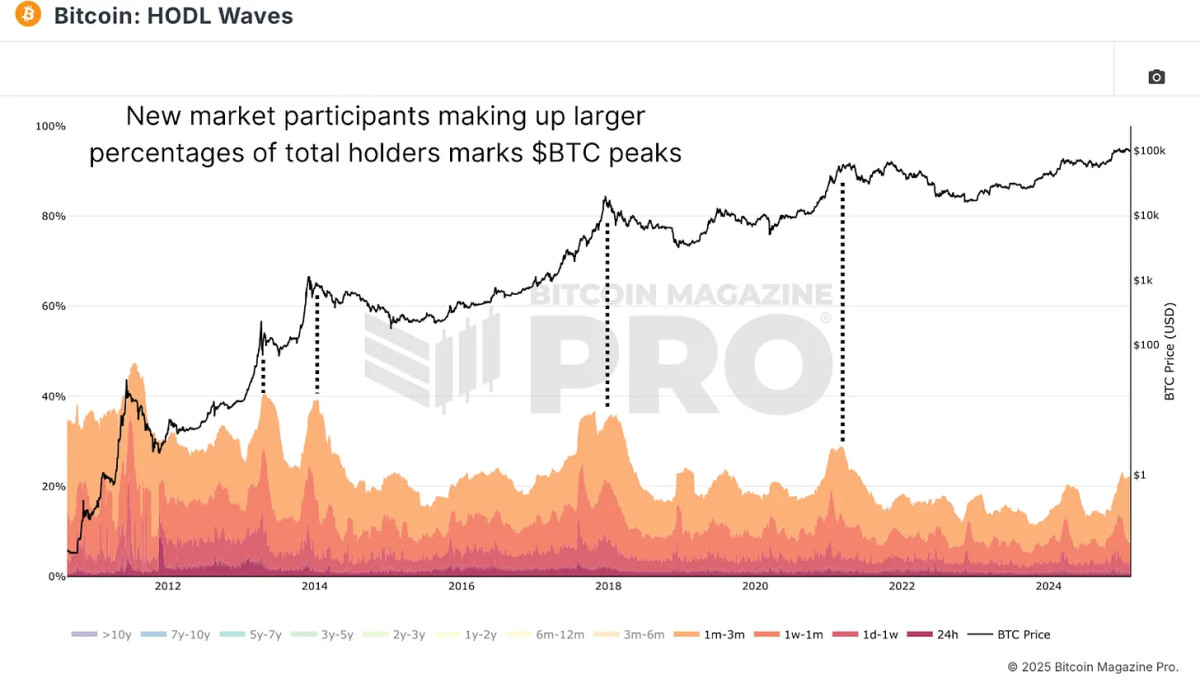
HODL Waves The entire distribution of Bitcoin owners by age bands is visualized. By filtering out participants who have been on the market for less than 3 months, we can see typical levels of retail participation. Short-term market participants are often a sign of the top of the market, while lower levels show ideal areas for accumulation.
Whale Movements
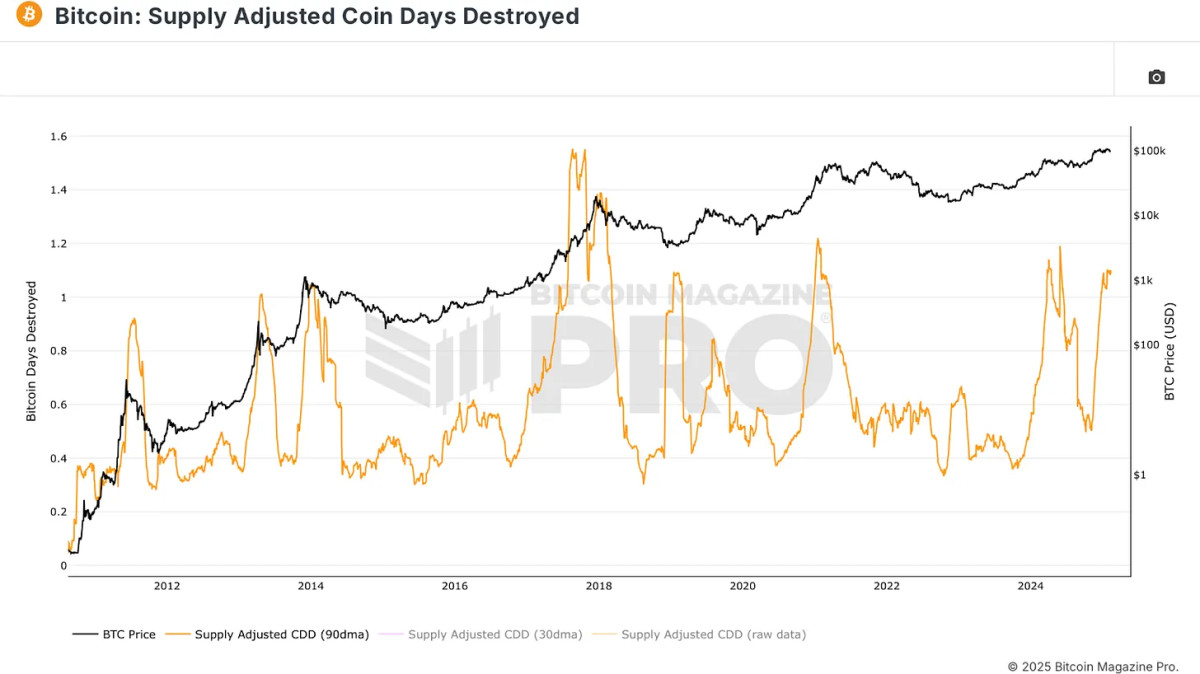
Supply Adjusted Coin Days Destroyed Quantifies total BTC, weighing it by the time spent holding the BTC, standardizing the data using the current circulating supply. You can use the following example.
- 1 BTC held for 100 days → 100 Coin Days Destroyed
- 0.1 BTC held for 1,000 days → 100 Coin Days Destroyed
This is an invaluable metric to detect whale activity or institutional profits. It is often a sign of large investors exiting their positions when long-dormant coin suddenly moves. This data is correlated with market tops or bottoms according to historical data.
Realized Gains & Losses
You can also find out more about the following: Spent Output Profit Ratio (SOPR) The profitability of BTC transaction is revealed. The SOPR above zero indicates the average Bitcoin is moving in profit. While a value lower than 0 signifies the average Bitcoin is being sold at a loss. Trading can be done by observing spikes in SOPR. This allows traders to identify profit taking, and SOPR drops are often associated with bear markets.
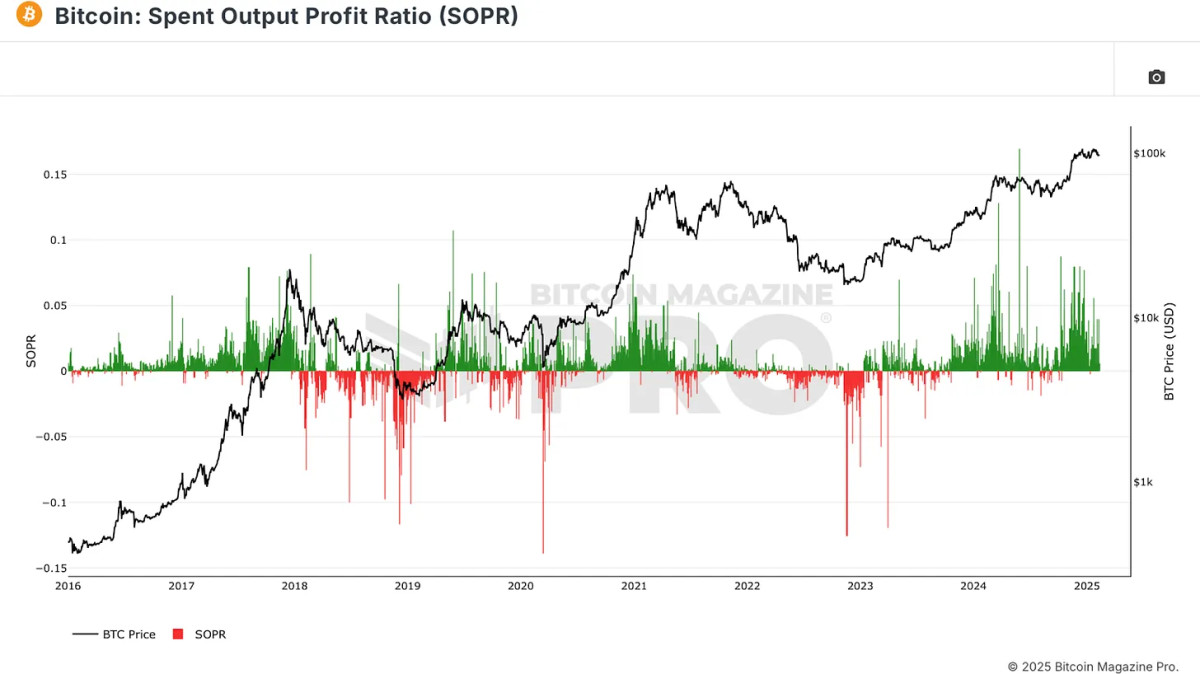
A single metric may be misguided. Investors should look for convergence between several on-chain indicators to increase their chances of receiving accurate signals.
As an example:
- MVRV Z score is green (undervalued).
- SOPR indicates high realized losses (capitulation)
- Waves of HODL show an increase in long-term investors (sales exhaustion).
This alignment marks historically optimal zones for accumulation. Confluence is also important for profit taking on BTC. Look for metrics that all point in the opposite direction to indicate overheated conditions.
You can also read our conclusion.
Bitcoin data on the blockchain provides investors with a real-time, transparent view of market dynamics. This gives them an advantage in making decisions. By tracking supply trends, investor psychology, and accumulation/distribution cycles, Bitcoiners can better position themselves for long-term success.
Visit Bitcoin Price Action to keep up with the latest data and charts. Bitcoin Magazine Pro.
Disclaimer: This is not financial advice. It’s just for informational purpose. Before making an investment decision, always do thorough research.
“This article is not financial advice.”
“Always do your own research before making any type of investment.”
“ItsDailyCrypto is not responsible for any activities you perform outside ItsDailyCrypto.”
Source: bitcoinmagazine.com


