


- Open Interest and spot taker strength have risen, signaling a rise in demand.
- OP whale netflows are dropping while the liquidation clusters around $0.61 suggest resistance driven volatility.
From early June Optimism [OP] The key indicators are pointing to a bullish trend. Even though both the spot and derivatives markets are bullish, there is still a risk of crowding.
The Spot Taker CVD has shown a strong dominance of taker buyers over the last 90 days. This confirms the sustained demand on the spot market.
Simultaneously the Open Interest increased by 18.14%, to $194.92 millions, due to an increase in leveraged exposure. Volatility tends to increase when spot and Futures markets both heat up.
The question now is—will this demand extend the rally or spark a correction from overly aggressive longs?
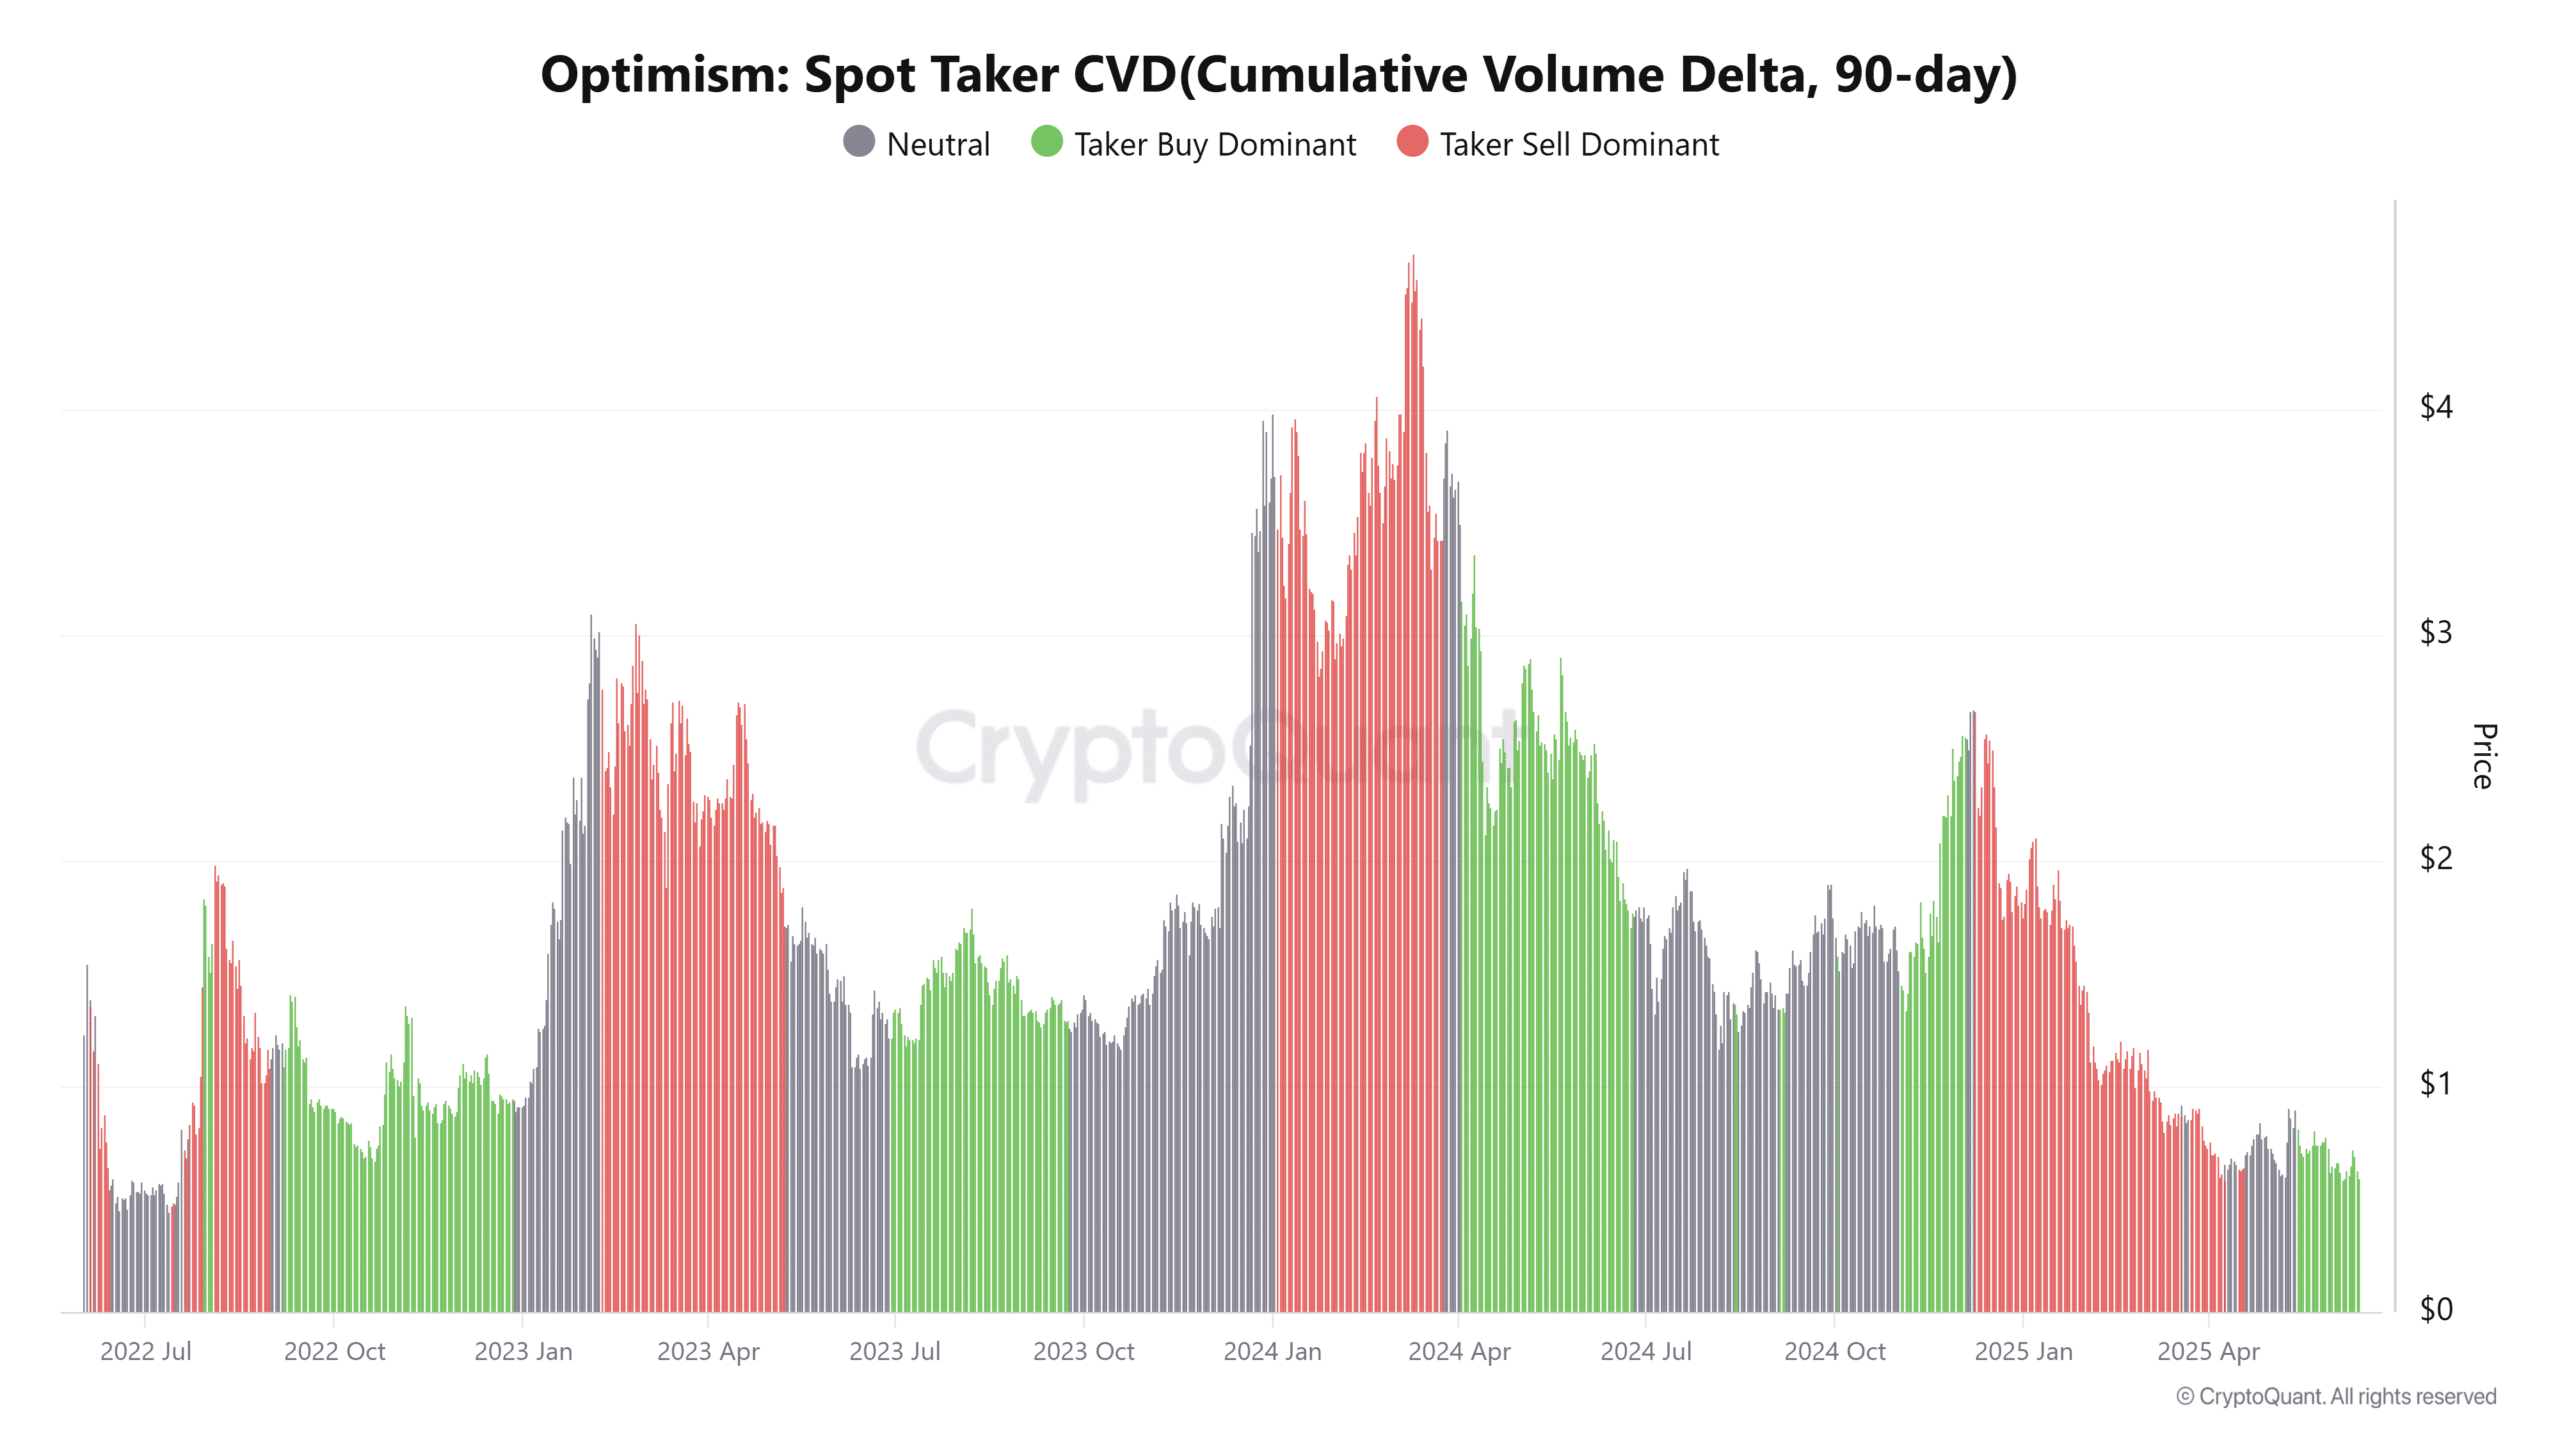
CryptoQuant
Do OP whales accumulate or prepare to leave?
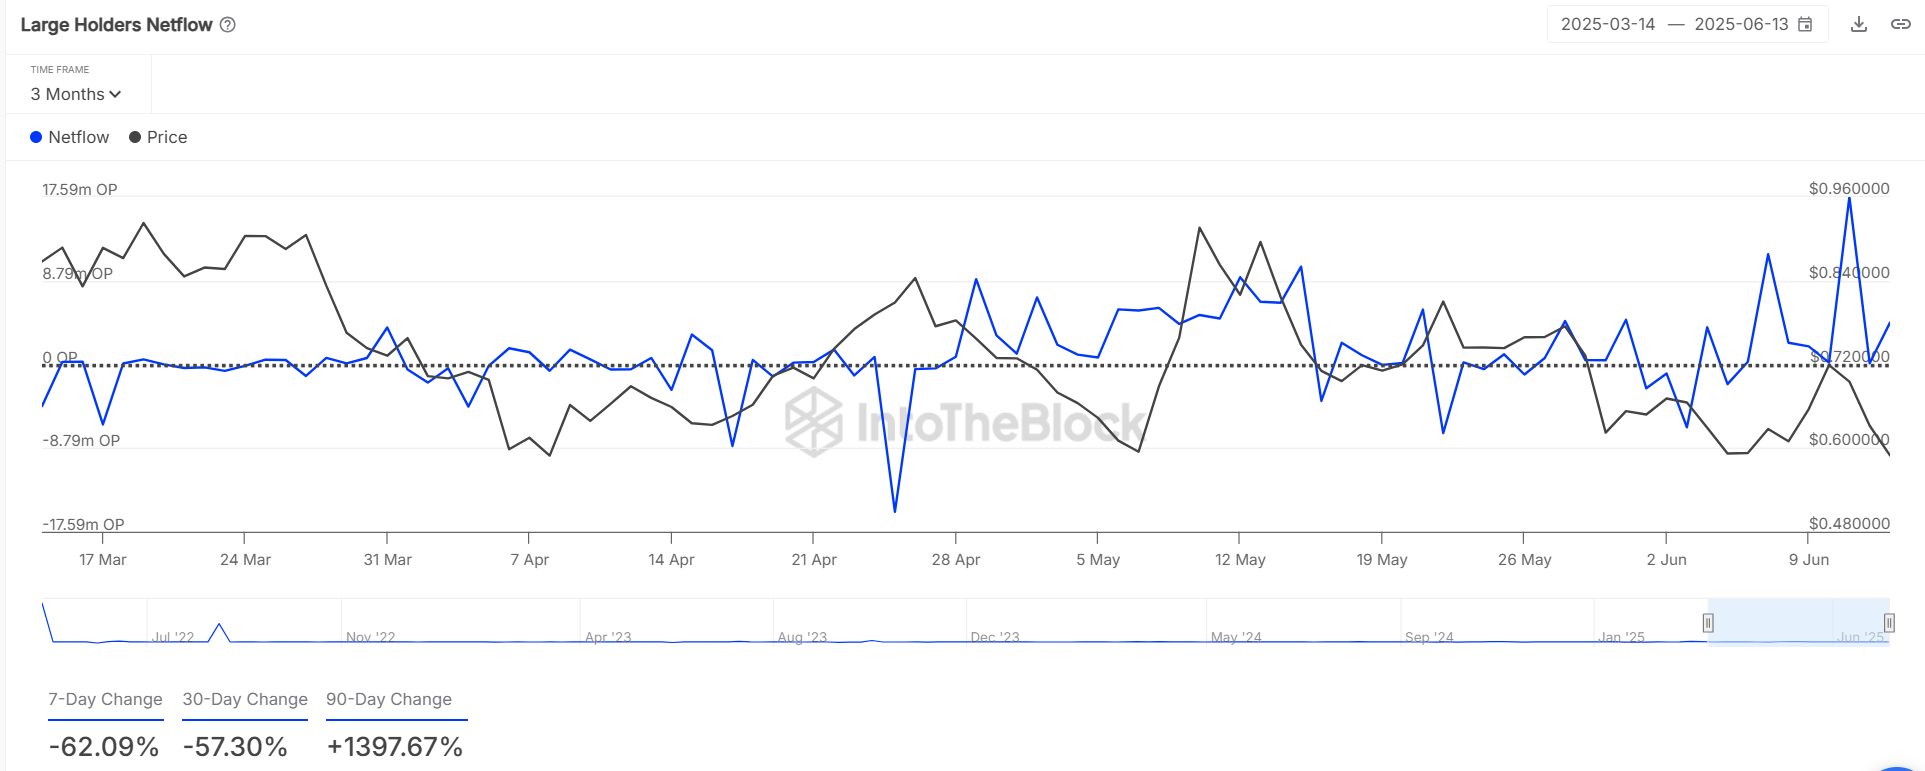
The netflow of large holders has been sharply reduced, falling 62% in the last seven days. This week’s drop suggests that, despite the 1,397% increase over 90-days, whales may be making profits.
Recent exit activities could create uncertainty.
If the repositioning is only temporary, OP might stabilize. However, if the distribution of shares continues then recent gains might be reversed quickly.
Source:
Renewing investor interest
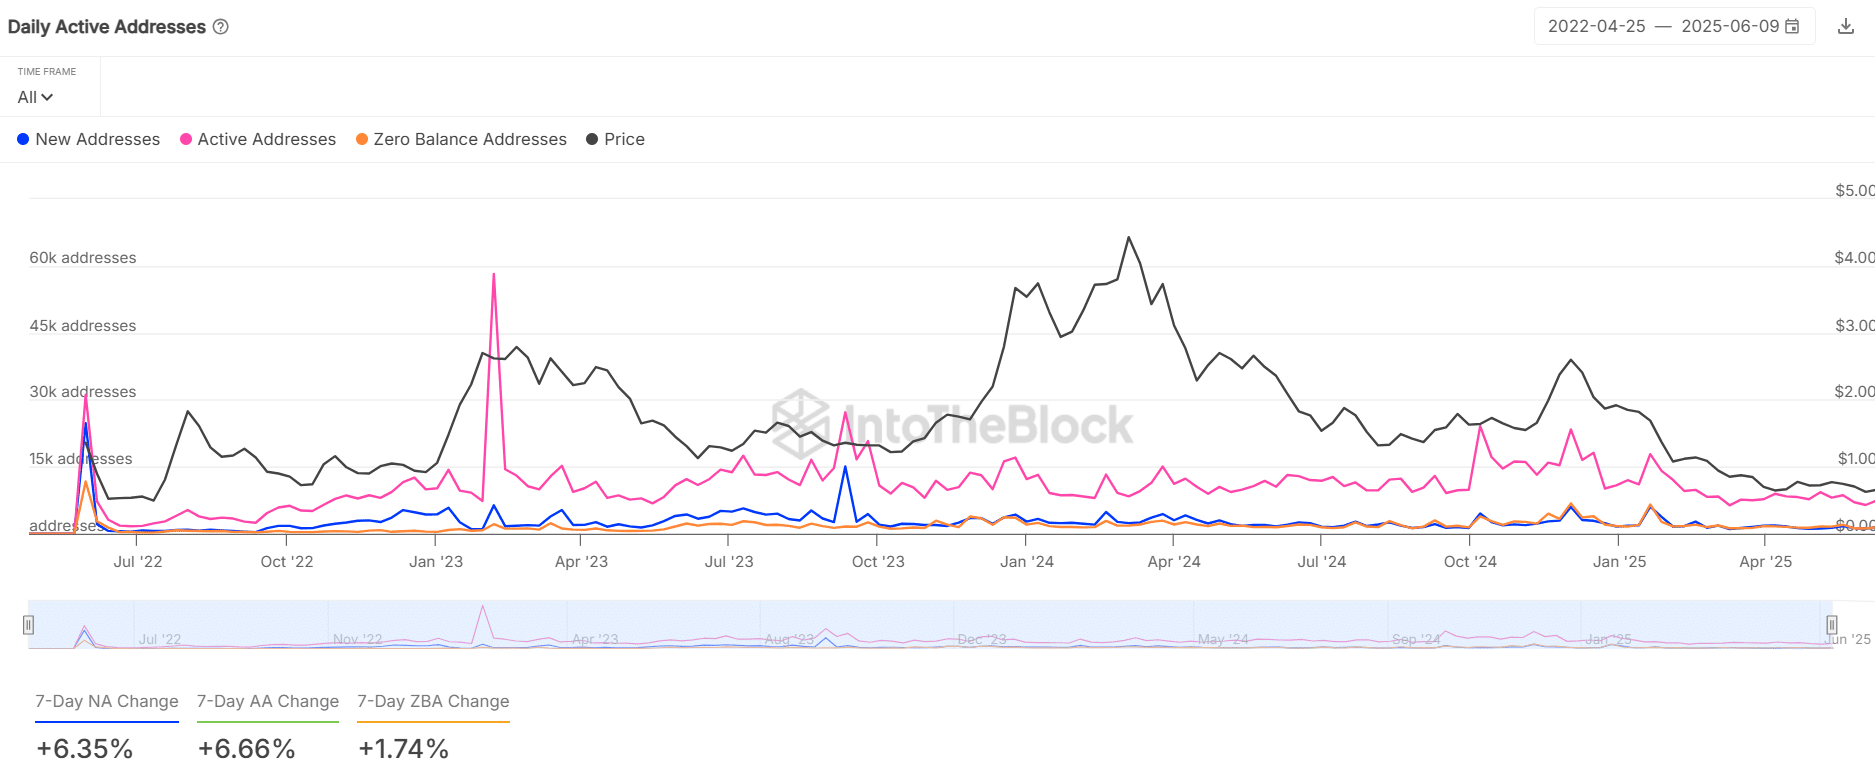
The network activity has continued to increase steadily. Daily Active Addresses increased by 6.66%, and New Addresses rose by 6.35% over the last week.
The retail network is slowly returning.
Additionally, the number of Zero Balance addresses increased by 1.74 %, indicating both turnover and new engagement. Together, these metrics confirm the current bullish movement.
The rise of unique wallets adds credibility to recent price increases, and reduces the possibility that they are manipulated.
Source:
Can compressed volatility lead to the next big breakout?
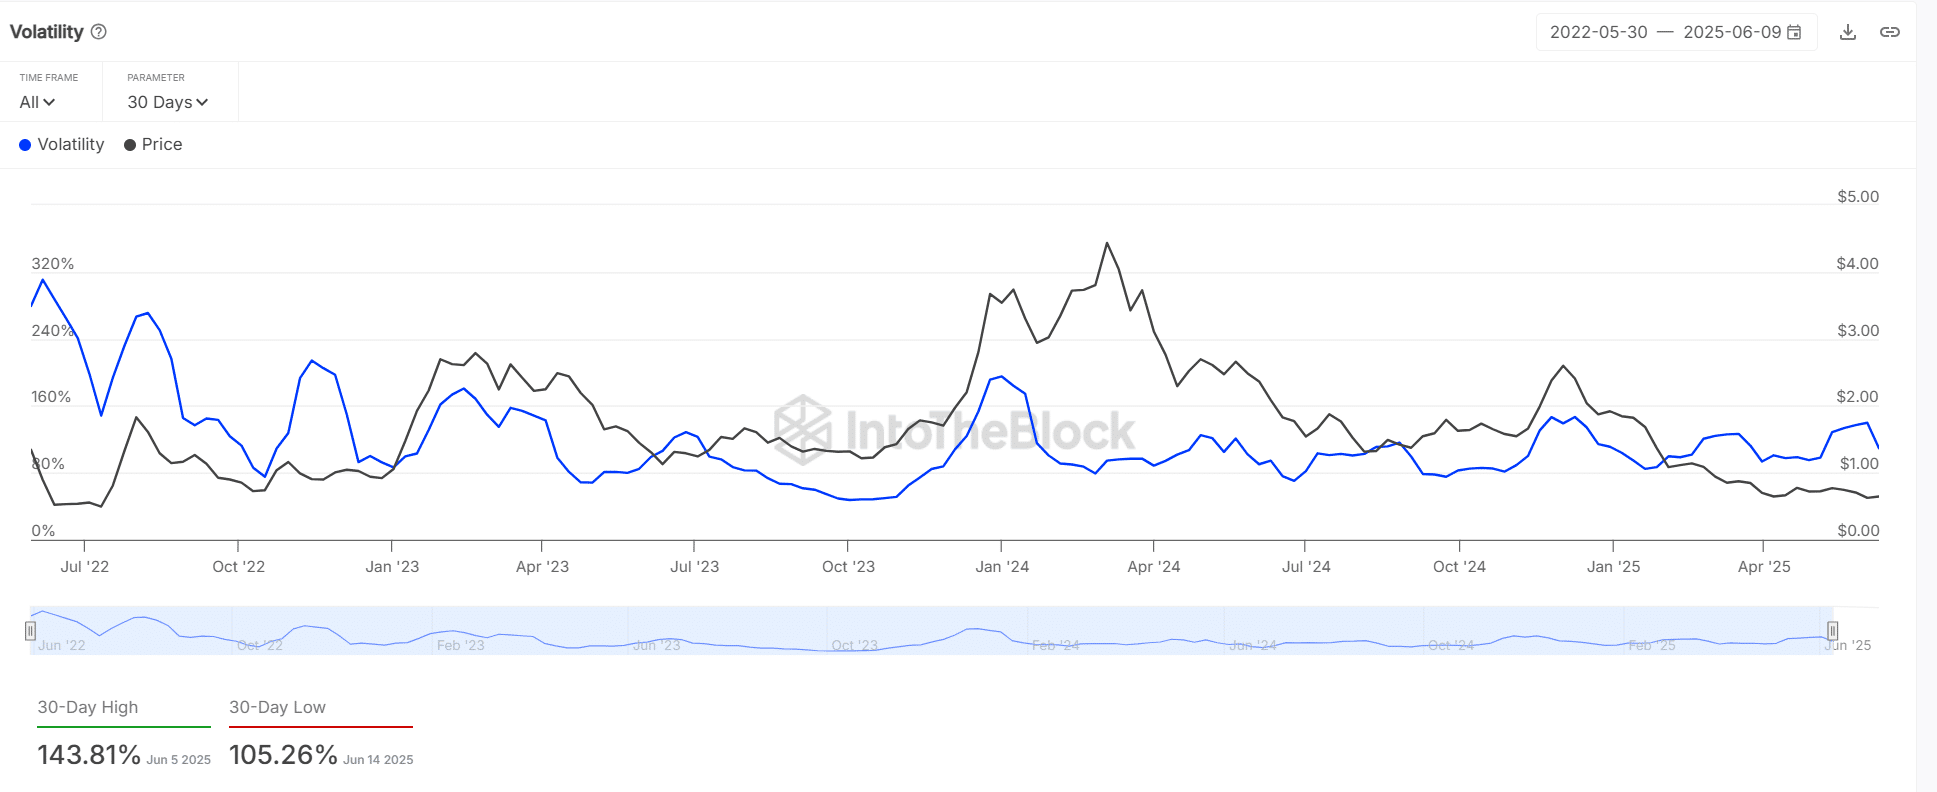
Optimism’s 30-Day Volatility fell to 105.26%. This is the lowest level in more than a month. In history, periods of low volatility have frequently preceded strong directional moves.
If momentum is built, it could be a catalyst for a break out above or towards $0.61. It can also easily fall back if there is no catalyst.
Source:
Is the price of liquidation clusters at $0.61 going to be the next big thing?
The Binance Liquidation Heatmap showed dense clusters of short liquidations in the region above $0.60, and multiple stacks near $0.61.
OP is testing this level of resistance. Any breakout can trigger a series of short liquidations that will fuel a rapid rise. Failure to breach above this level could result in sharp reversals.
The $0.61 level remains the key one to monitor, as it acts both as a barrier and a magnet depending on how much pressure is applied.
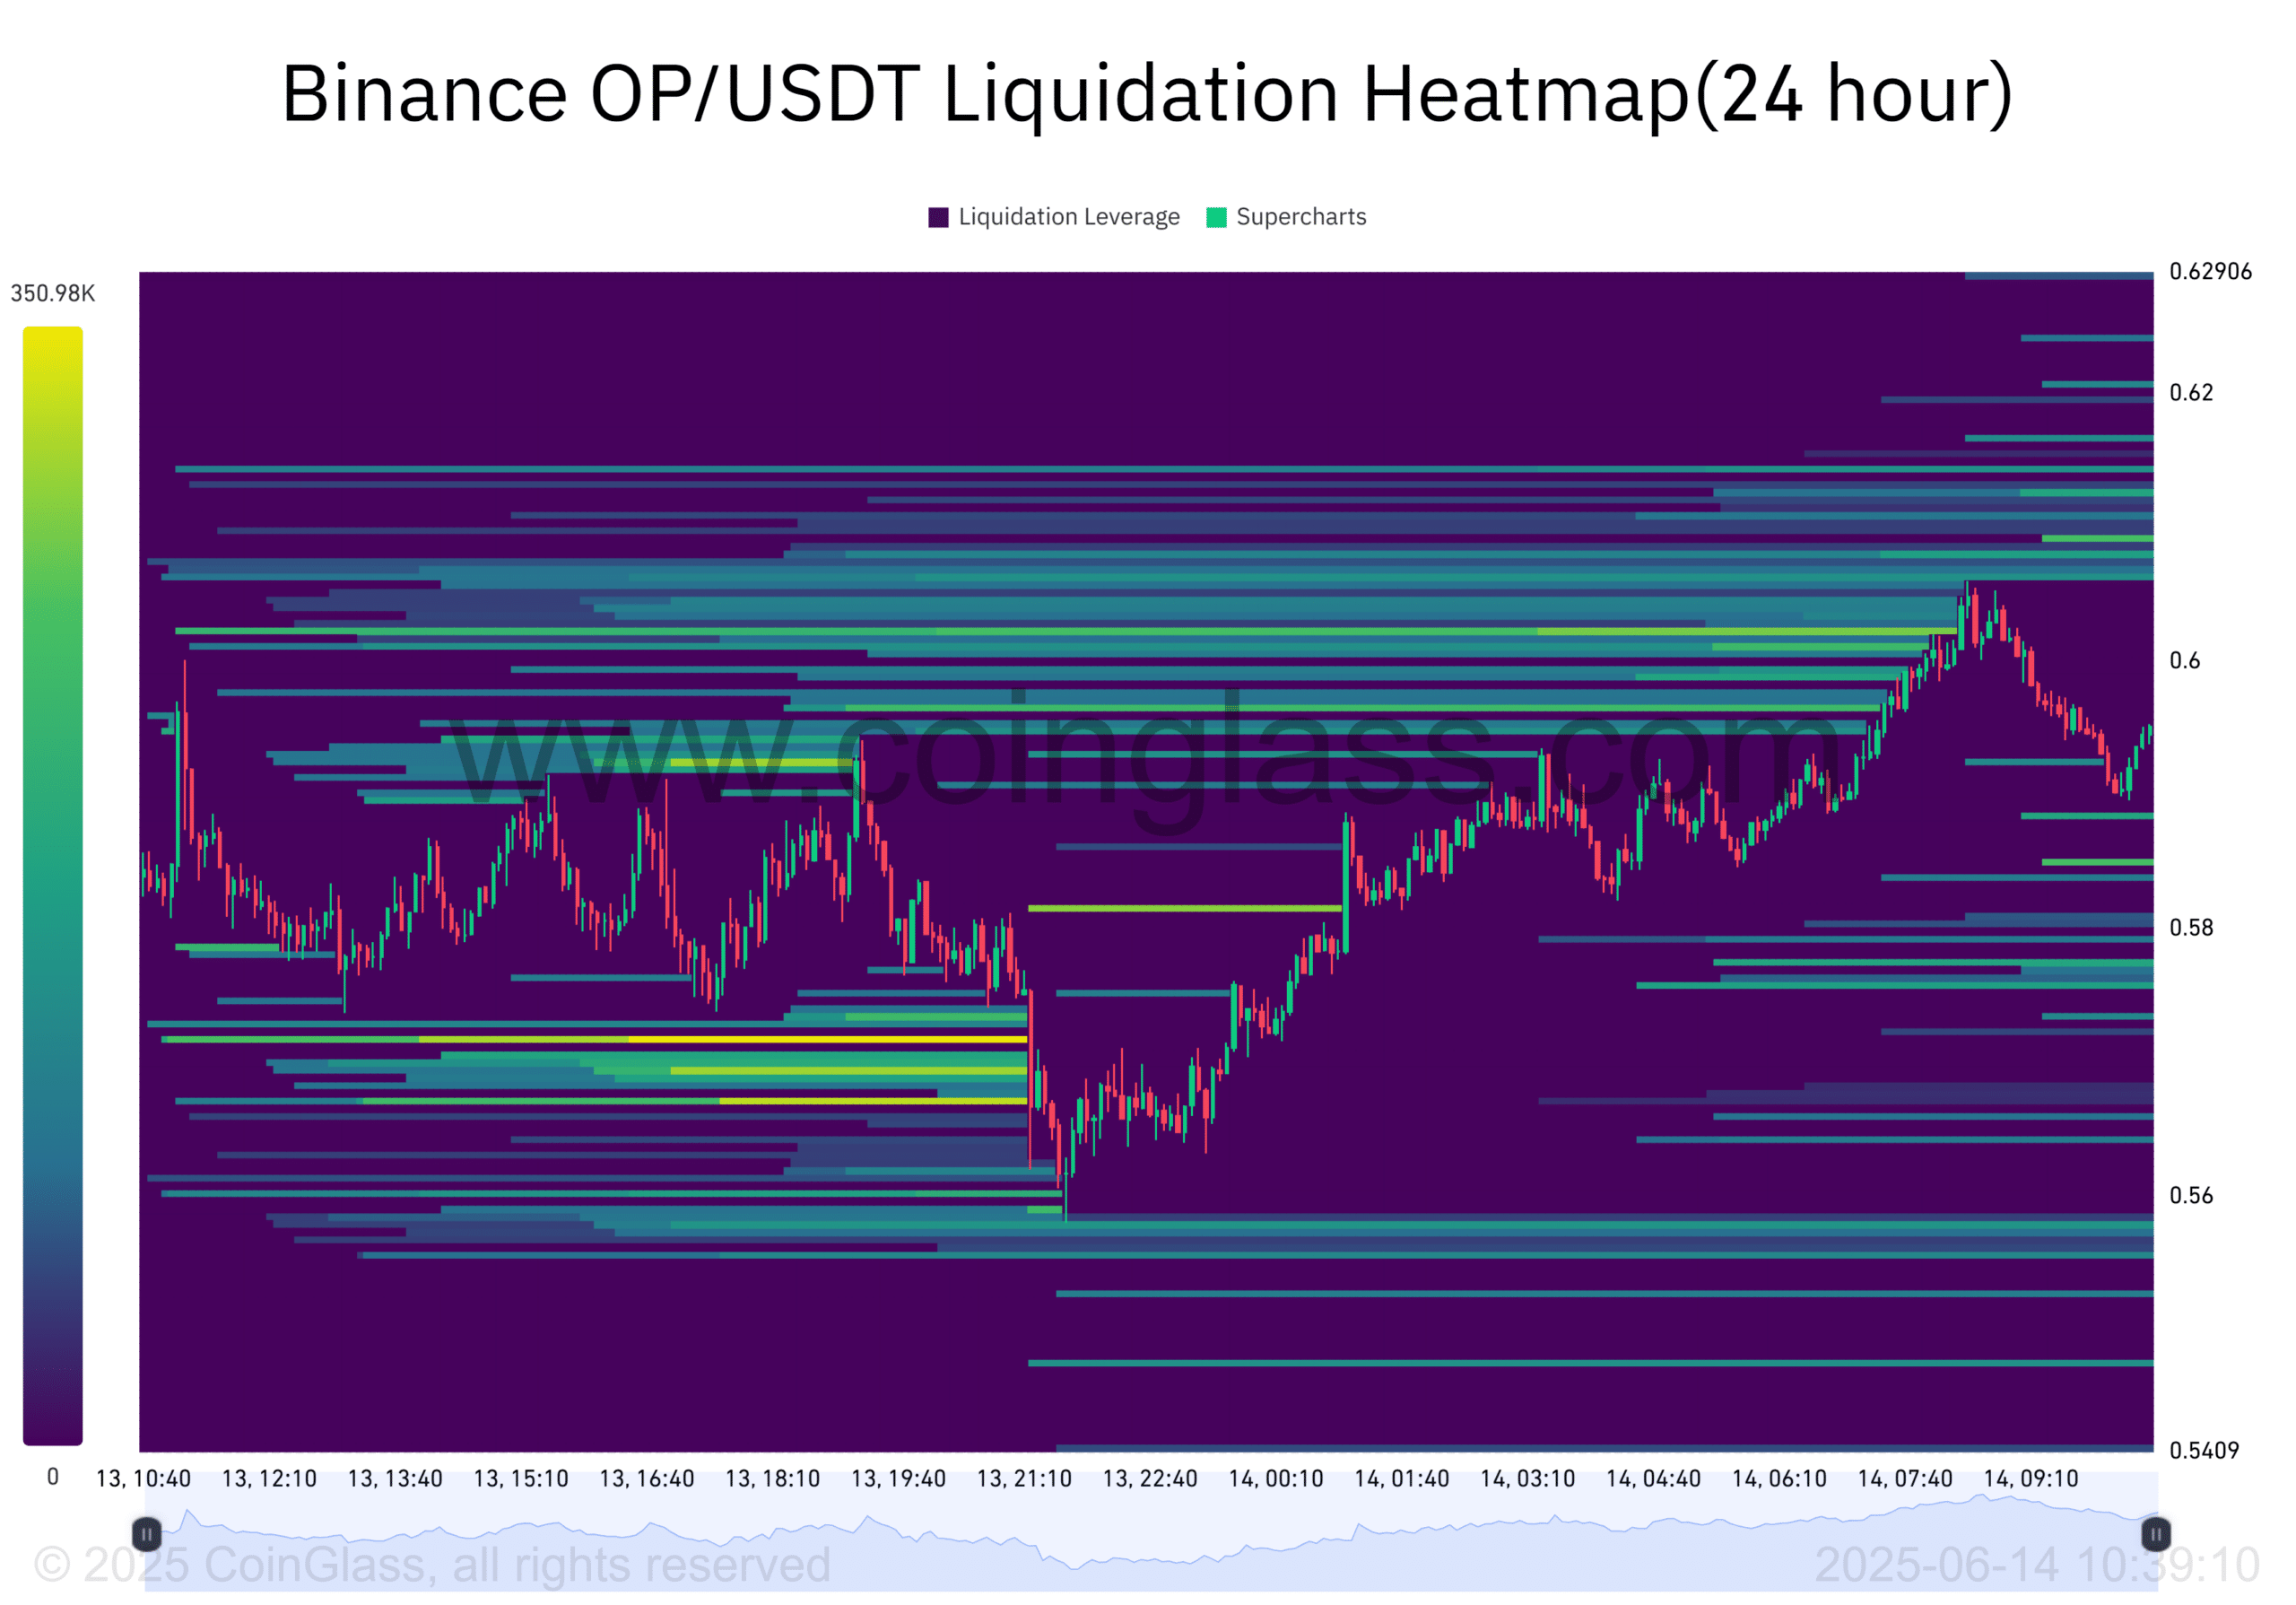
CoinGlass
A combination of rising Open Interest and address activity with takers’ buy strength suggests that a bullish scenario is in place. Whale exits, and the key resistance level of $0.61 require caution.
The breakout of this level would unlock additional gains. Failure to do so could invite volatility as a result of liquidations and unwinding leverage.
“This article is not financial advice.”
“Always do your own research before making any type of investment.”
“ItsDailyCrypto is not responsible for any activities you perform outside ItsDailyCrypto.”
Source: ambcrypto.com


