


Bitcoin’s price began to rise at the beginning of the US trading session, despite a recent assault on the 200-week moving average.
Bitcoin (BTC) hit $67,000 at Wednesday’s Wall Street open as bulls shook off fresh US tariff pledges.
Key points:
-
Bitcoin enjoys a sustained rebound as BTC price action rises above $67,000.
-
A key long-term trend line now comes back into view, with the weekly close in focus.
-
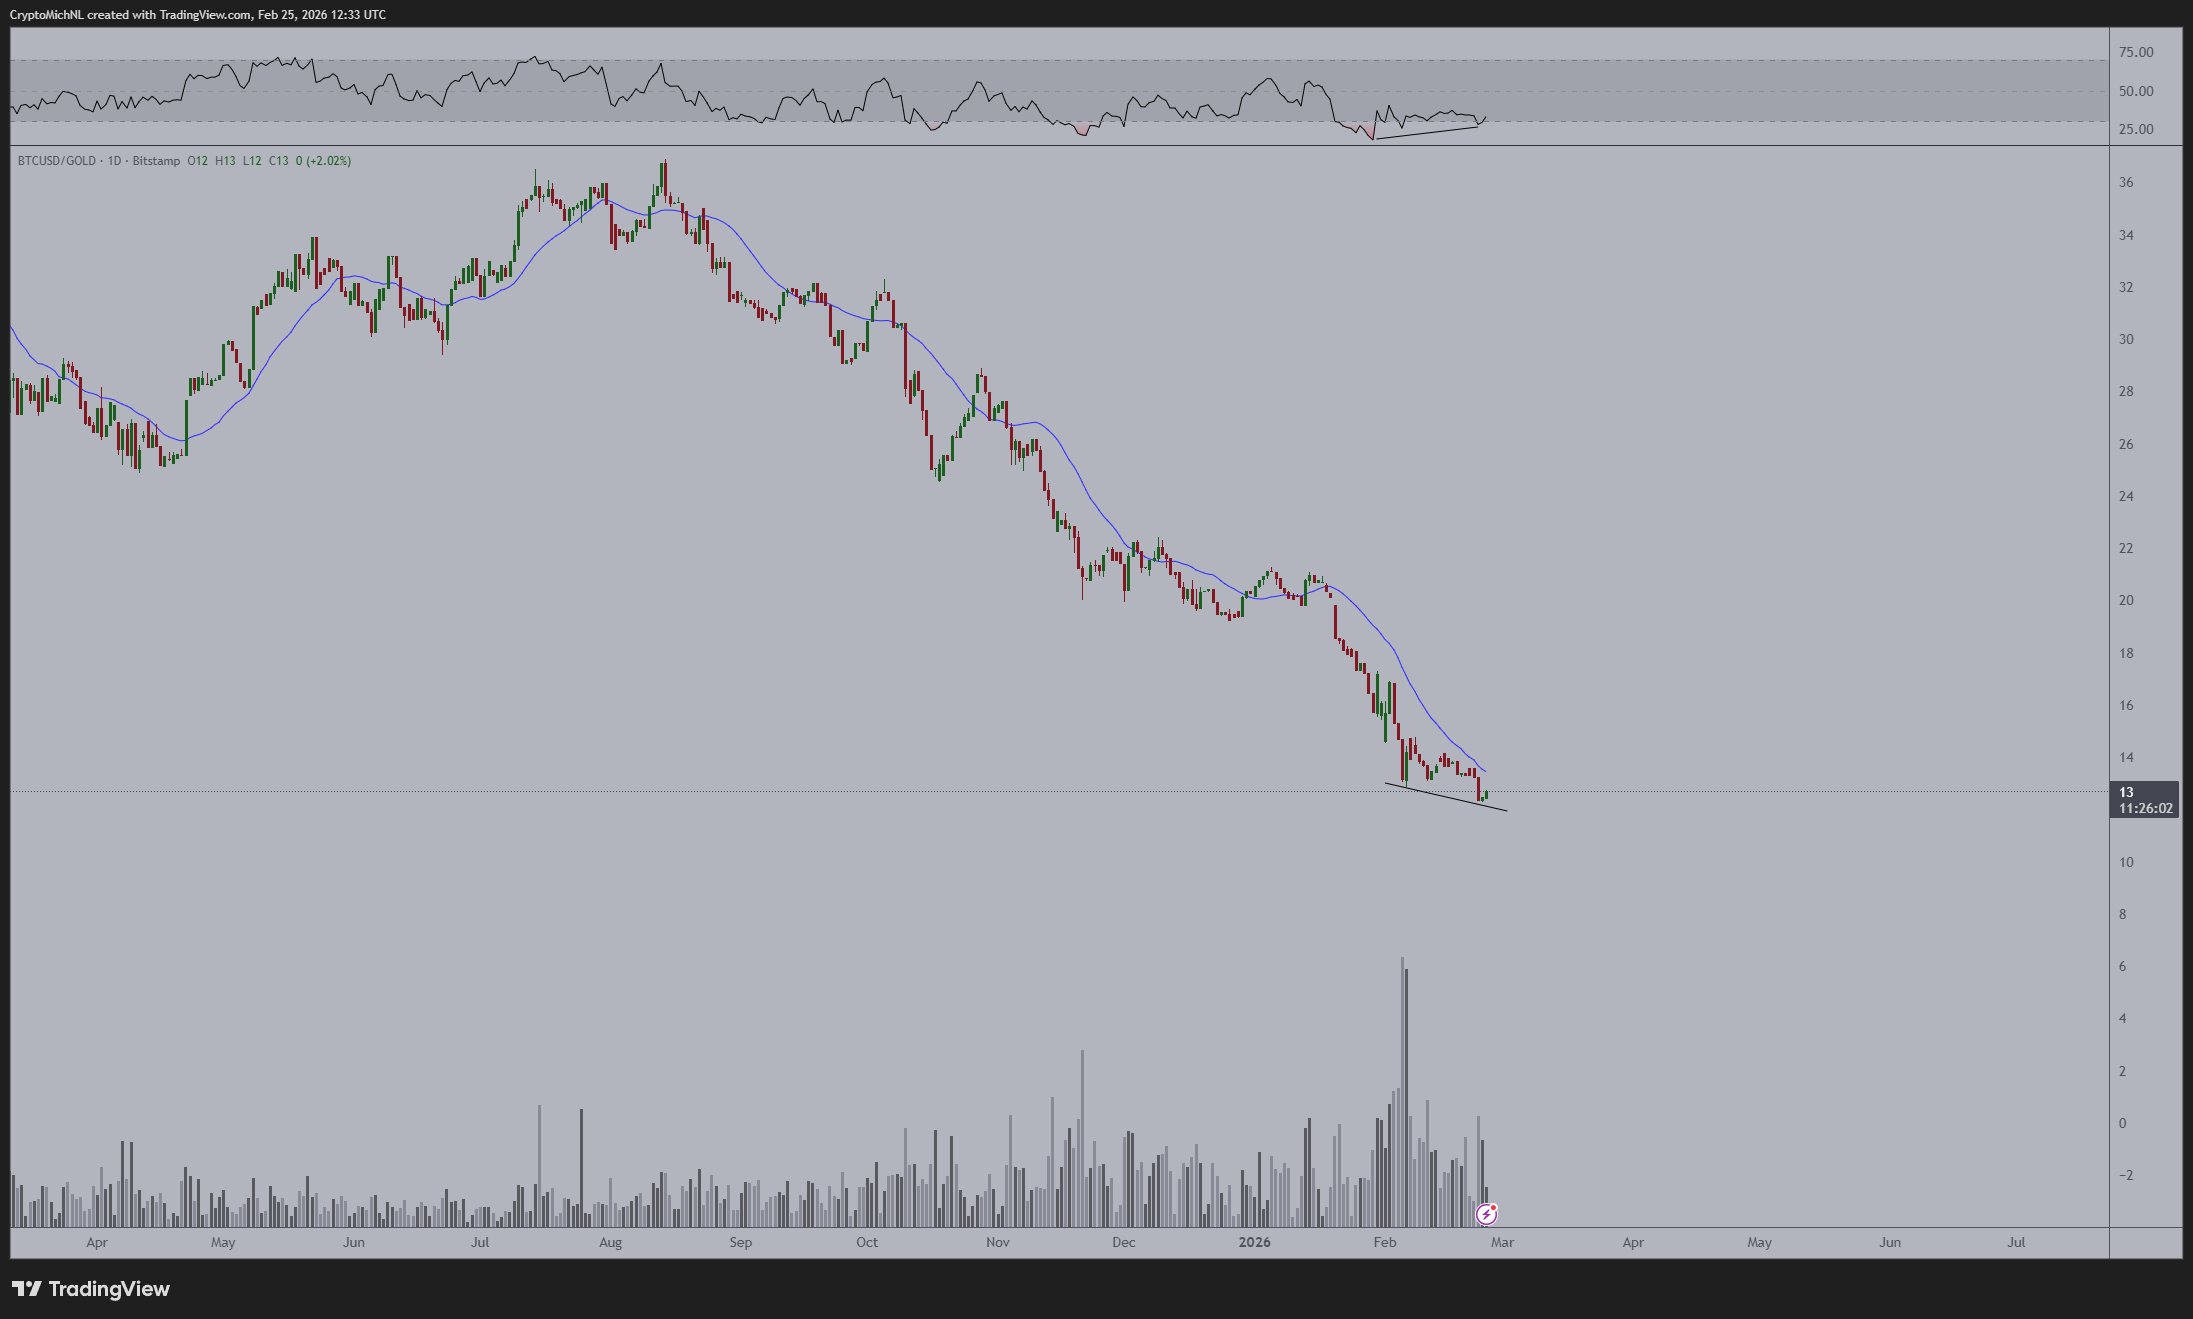
Gold analysis reveals a developing RSI divergence with Bitcoin.
BTC price sets up rematch with 200-week trend
Data from TradingView showed daily BTC price gains hitting 4.5% as a local rebound continued.
Bitcoin appeared unfazed by an announcement from US Trade Representative Jamieson Greer over 15% tariffs, which may become reality “within the coming days.”
“So right now, as we talked about, 10% is in place. There will be a proclamation raising it to 15% where appropriate,” he told Bloomberg.
Tariff headlines often spark volatility in crypto markets, with their impact nonetheless cooling in recent months.
Already enjoying respite from sustained selling pressure, BTC/USD thus approached a key long-term level in the form of the 200-week exponential moving average (EMA).
As Cointelegraph reported, BTC price losing the level as support has become a classic bear market signal.
Commenting, trader and analyst Rekt Capital repeated analysis from earlier in February, suggesting that the upcoming weekly close should be above the 200-week EMA, now at $68,330.
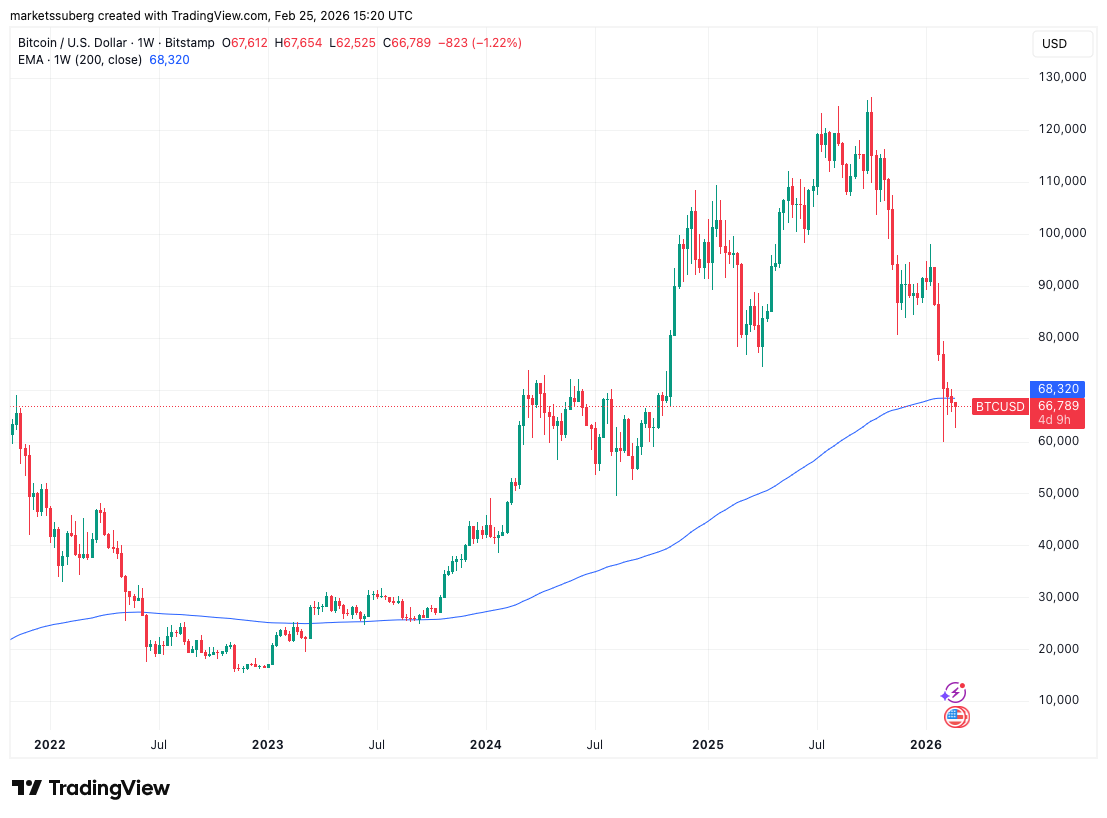
Trader Castillo Trading also eyed weekly time frames, with a potential upside target near $74,500, Bitcoin’s 2025 yearly lows.
Still watching the same Weekly structure on $BTC.
Nice start on the bounce, and if this continues to hold as a support level a good re-test and potential short could be that 2025 Yearly Lows level around $74,492.#Bitcoin https://t.co/olaw6RO9Kr pic.twitter.com/NYHWSu8d5q— Castillo Trading (@CastilloTrading) February 25, 2026
Bitcoin teases RSI bullish divergence versus gold
As gold ranged above the $5,000 per ounce mark, meanwhile, crypto trader, analyst and entrepreneur Michaël van de Poppe saw reason for Bitcoin bulls to stay optimistic.
Related: Bitcoin ETF sell-off is ‘purification’ of bull case, investor says
“Interesting enough; There’s a strong bullish divergence on the daily chart of $BTC vs. Gold,” he told X followers on the day, referring to the relative strength index (RSI).
“It’s not confirmed, but given the recent strength (today and yesterday) in Bitcoin, I think a slight rotation is starting. It’s about time.”
Such a turnaround in capital flows would upend market opinions from earlier in the year.
As Cointelegraph reported, analysis even concluded that Bitcoin had lost its quest to be “digital gold” with its comedown from October 2025 all-time highs.
The article is not intended to provide investment advice. Each investment or trading decision involves risk. Readers should do their own research before making any decisions. Cointelegraph, while striving to give accurate information and in a timely manner, does not guarantee accuracy, completeness or reliability. The article could contain statements which are forward-looking and subject to risk. Cointelegraph is not responsible for loss or damages resulting from your reliance upon this information.
“This article is not financial advice.”
“Always do your own research before making any type of investment.”
“ItsDailyCrypto is not responsible for any activities you perform outside ItsDailyCrypto.”
Source: cointelegraph.com


