


Market analysts said Bitcoin’s (BTC) latest rally to $76,000 was a “clear momentum shift,” confirming a short-term uptrend for BTC price.
Glassnode data shows that BTC/USD still hasn’t exhausted its bear-market rally. The short-term holding (STH), a measure which measures the amount of coins acquired recently and currently being held for an unrealized profit, is indicative of this.
This metric has historically been used to form local tops of bear market rallies when it approaches the statistical average of 54.2%. At this threshold, the concentration of profitable STHs is sufficient for meaningful distribution.
Currently at 43.2%, the STH supply in profit remains “meaningfully below that threshold, suggesting the present rally has not yet reached the zone of typical exhaustion,” Glassnode said in its latest Week Onchain newsletter, adding:
“This leaves slight room for further upside toward the True Market Mean, while also providing a quantitative level to monitor as price advances.”
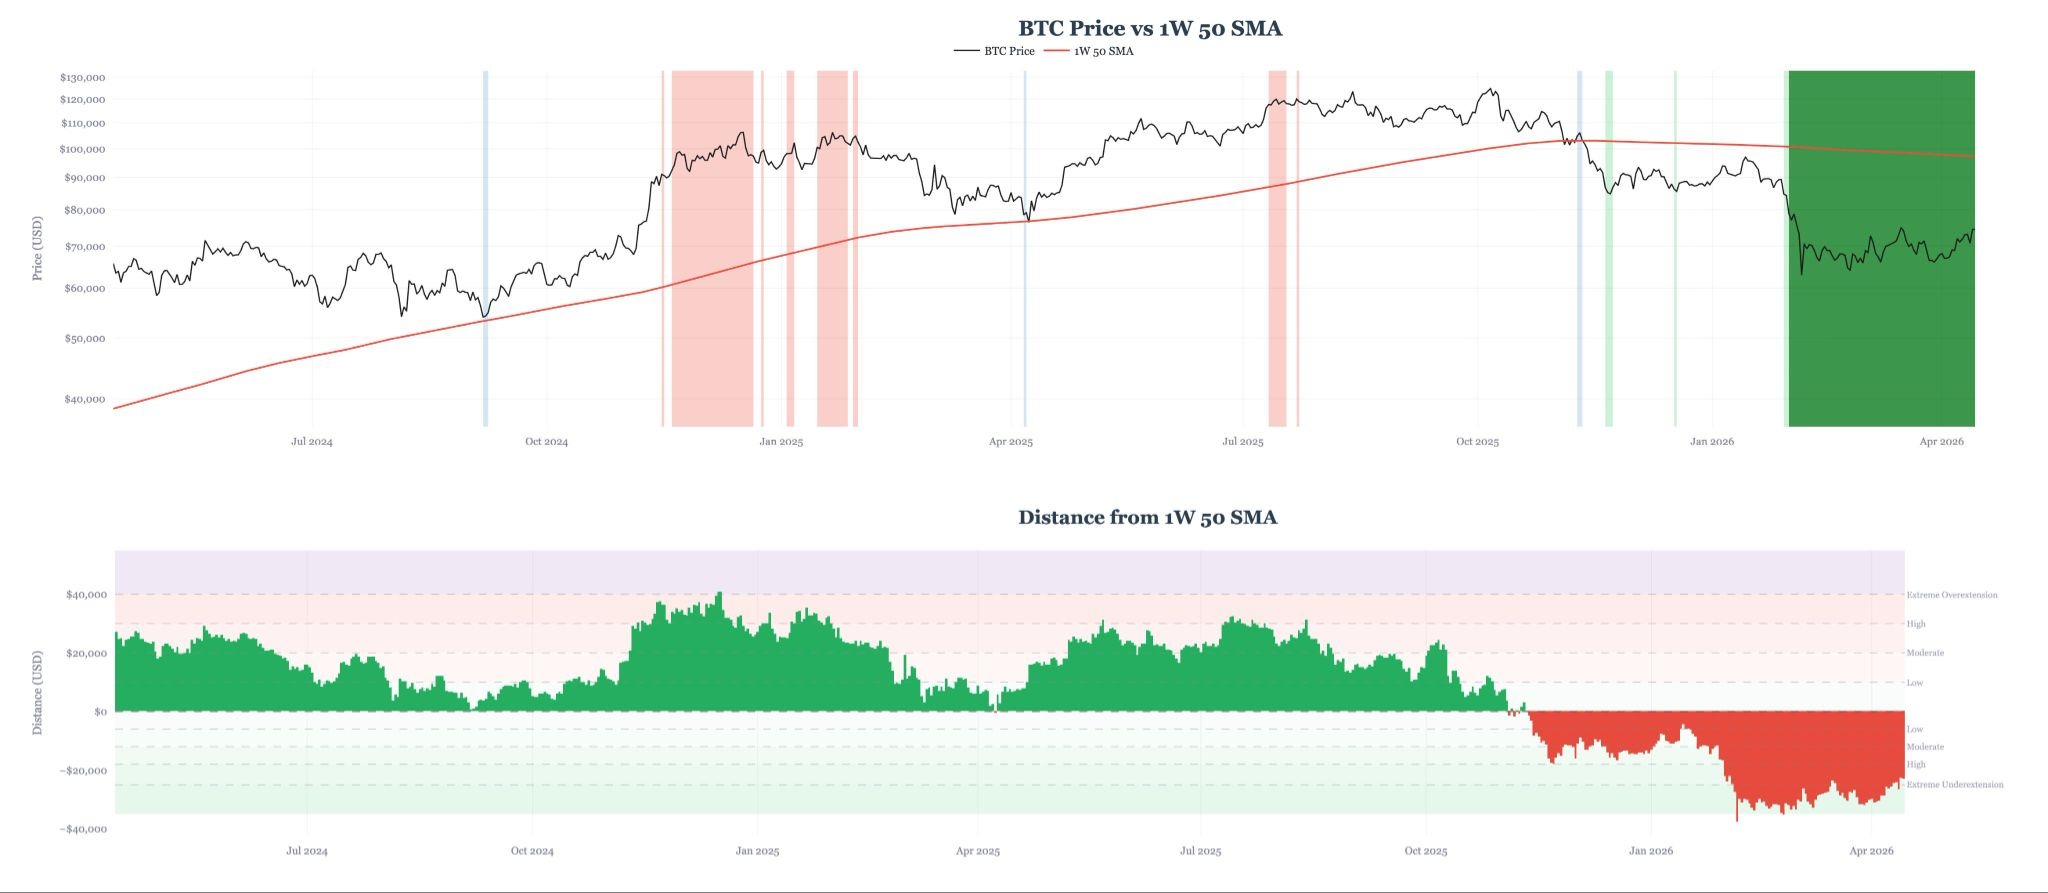
Meanwhile, Bitcoin has remained in “deep under extension territory” relative to its 50-week simple moving average (SMA), analyst McKenna said in a recent post on X.
Related: Bitcoin traders cash out 63K BTC profit as price rallied above $76K: Will the market rebound?
When markets deviate either to the upside or downside, they usually revert back to their mean.
Combined with “clear momentum shifts and bullish trending signals firing then I would be inclined to be directionally bullish here, the analyst said, adding:
“BTC breaking above $74K and holding this level on a HTF is the final trigger I want to see to be confident in mid to high 80s over the coming weeks.”
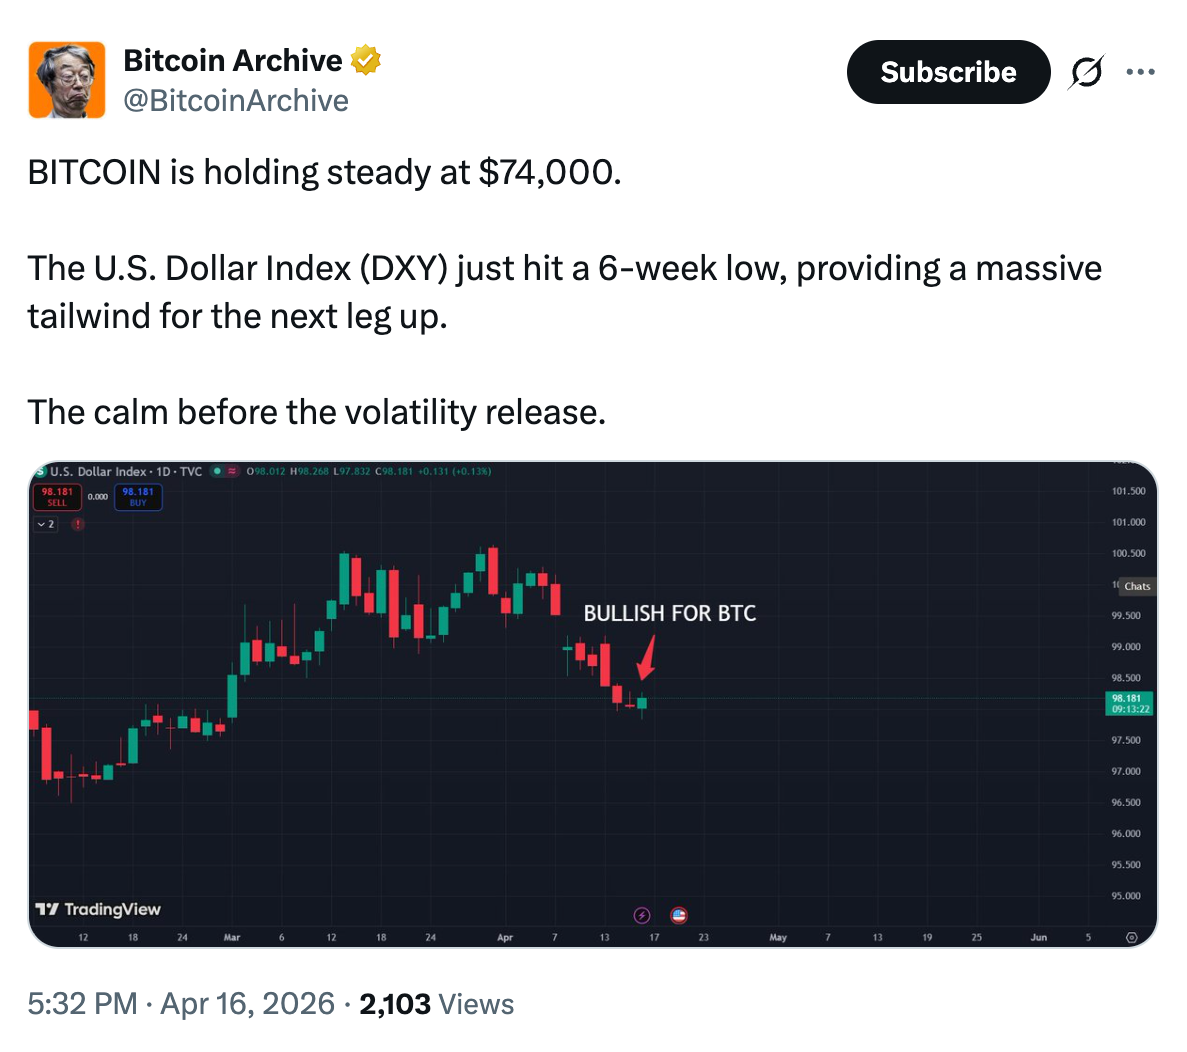
Fellow analyst Bitcoin Archive focused on the falling US dollar index, saying that it provides a “massive tailwind for the next leg up” for Bitcoin.
As Cointelegraph reported, several metrics support Bitcoin’s potential to rise higher, including increasing network activity and a strengthening technical setup.
Onchain data reveals key Bitcoin price levels to watch
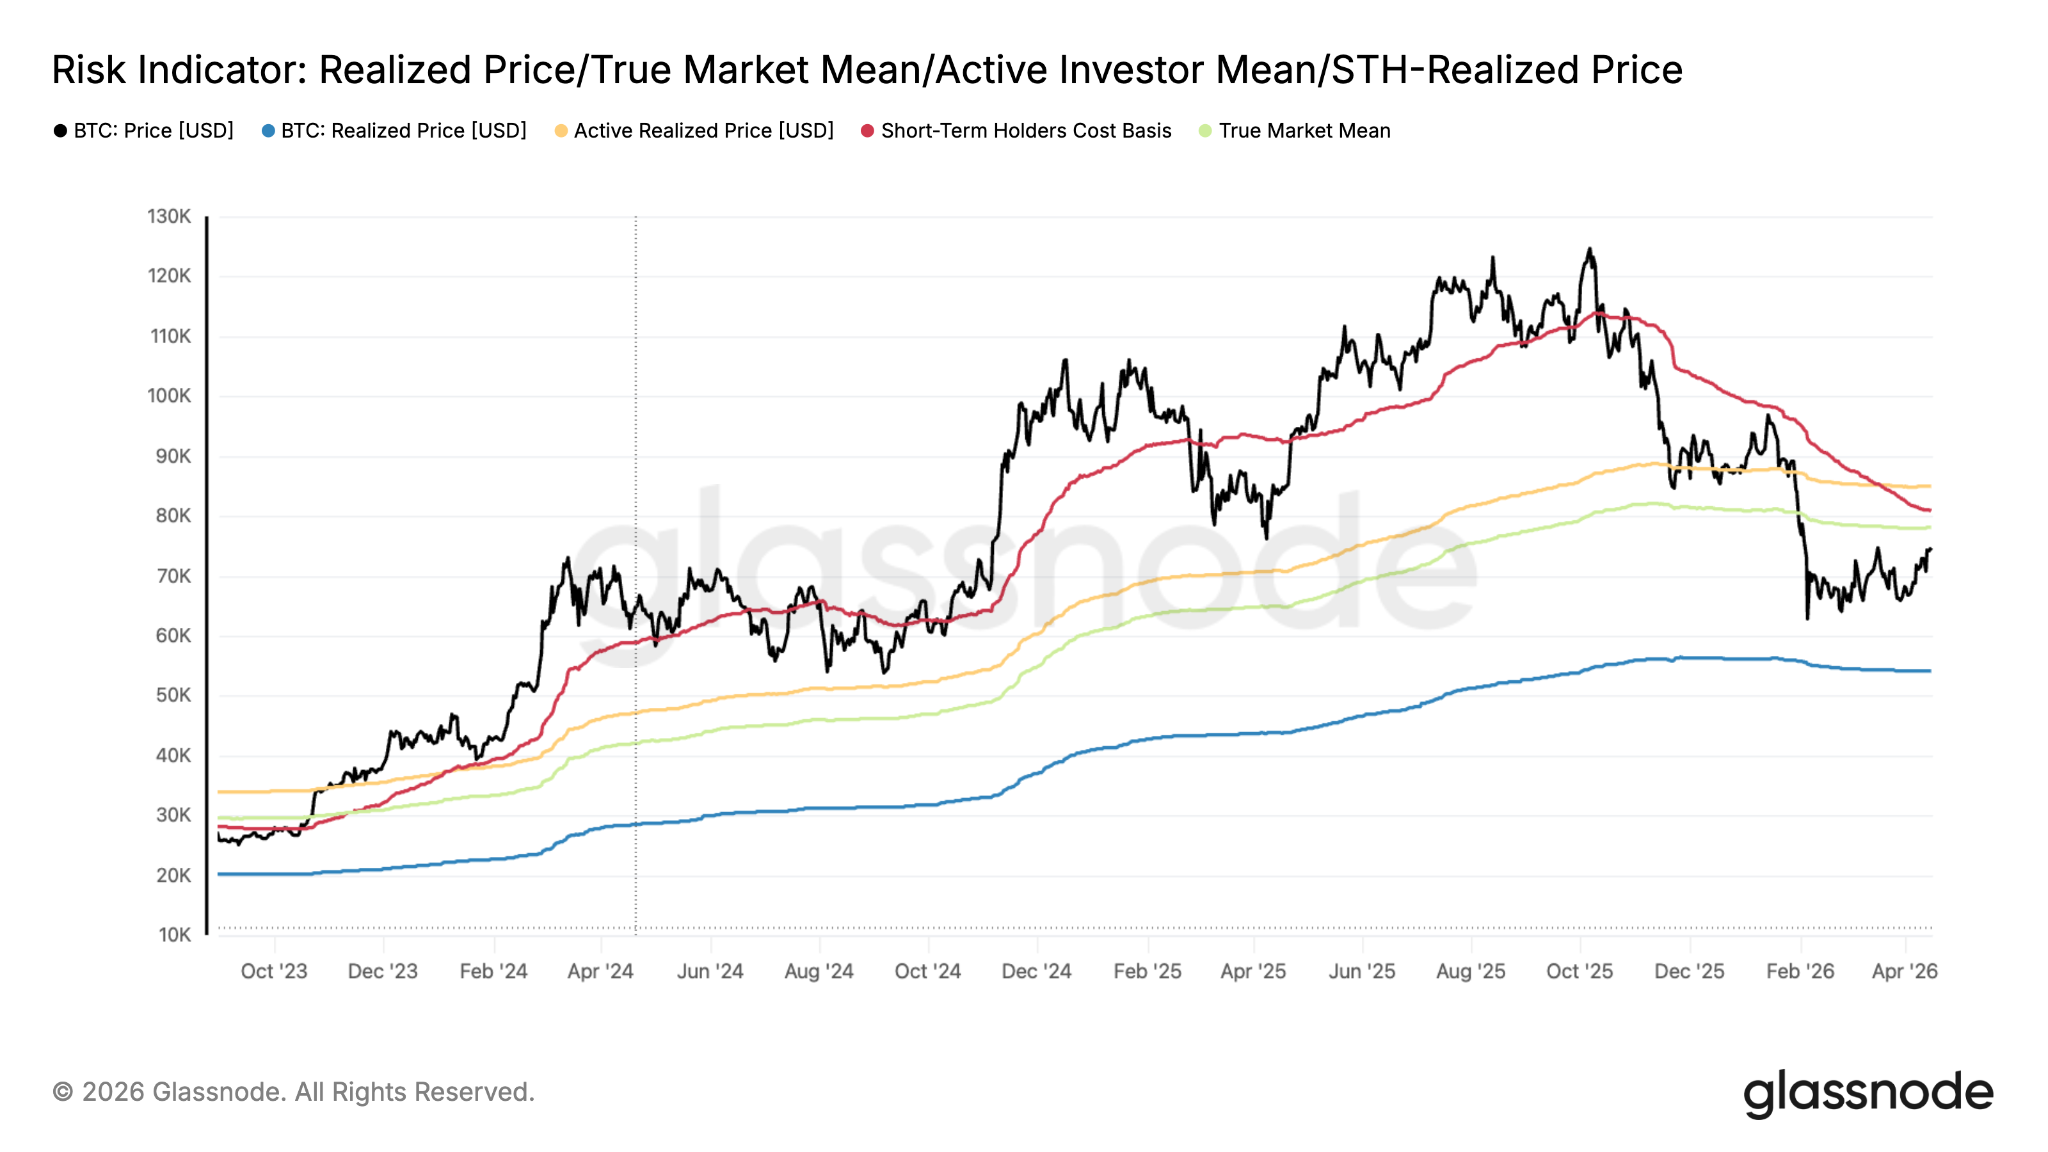
Bitcoin’s 41% drawdown from its $126,000 all-time high has seen the BTC/USD pair drop below key pricing levels, including the active realized price at $85,100, the STH cost basis at $80,950 and the true market mean currently at $78,140.
At $74,000, Bitcoin is 5.2% below the true market mean, a metric tracking the cost basis of active BTC supply.
While the price is yet to “test and stabilize above this key threshold, the probability of a spike toward and potentially above it remains considerable in the mid-term,” Glassnode added.
The importance of this resistance level is reinforced by cost basis distribution. The heatmap below shows that over 200,000 BTC were acquired for around $78,000.
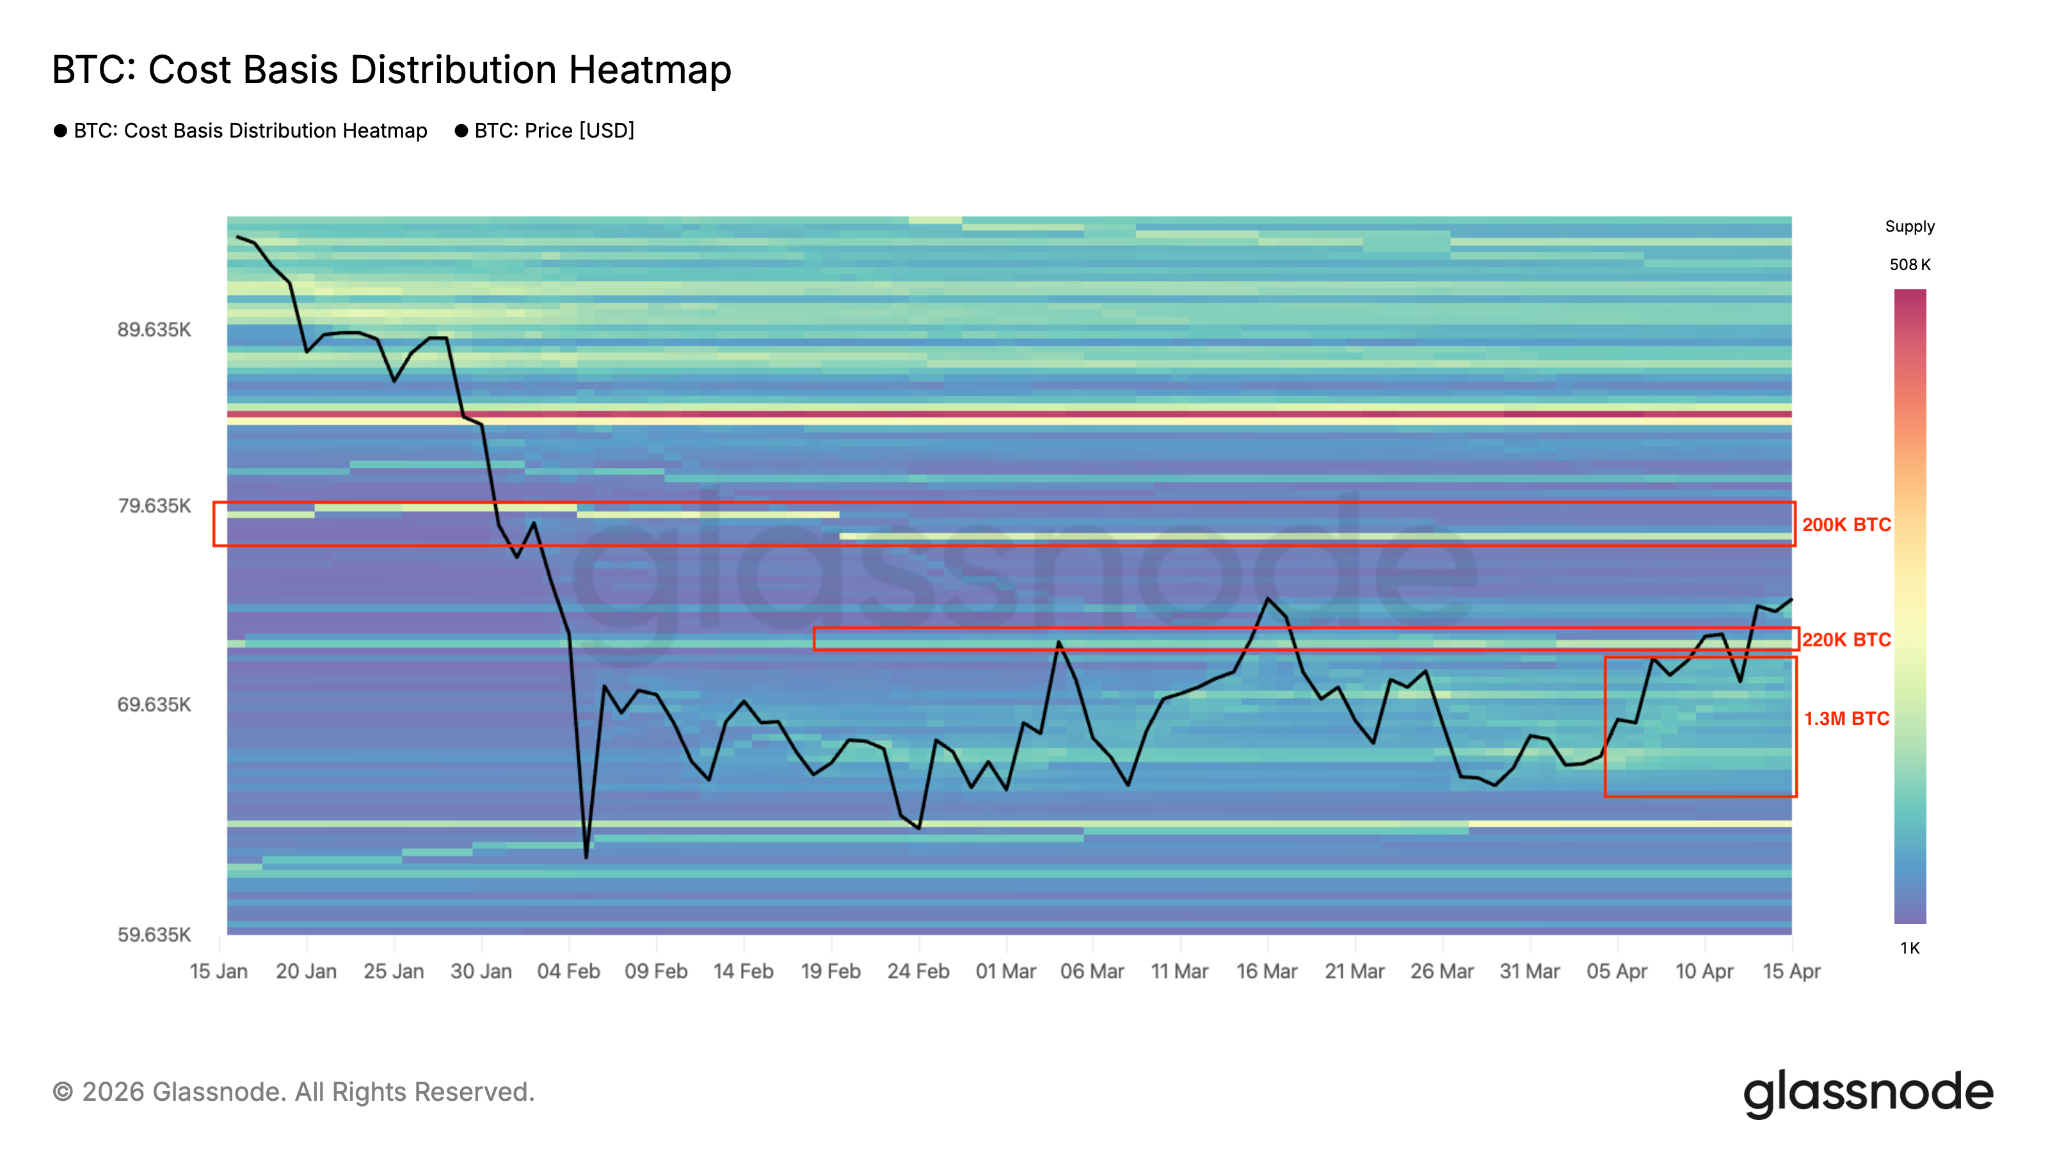
On the downside, the first major support is at $72,000, where the 20-day and 50-day exponential moving averages (EMAs) appear to converge. It is also where investors bought approximately 220,000 BTC.
Lower than that, the $65,000-$70,000 demand zone is a key area to watch. This price band has historically served as a vital support level, as seen between October and November 2024, providing a launching pad for the October 2024-January 2025 rally.
As Cointelegraph reported, a drop below the $70,000 would suggest the bears are back in control, increasing the prospects of a drop toward $60,000.
It is only for informative purposes and produced in compliance with Cointelegraph’s editorial policies. This article does not contain investment advice. The reader is encouraged to do independent research prior to making decisions. Cointelegraph does not guarantee the accuracy of information, or the completeness, or the forward-looking statement. It will also not be responsible for any damage or loss arising out of reliance on the content.
“This article is not financial advice.”
“Always do your own research before making any type of investment.”
“ItsDailyCrypto is not responsible for any activities you perform outside ItsDailyCrypto.”
Source: cointelegraph.com


