


The bitcoin price had a disappointing week last week. Bitcoin made a bullish run on Monday but quickly lost momentum as it retraced that move and ended up back at its lows. It was an interesting market, as it was widely expected that the Federal Reserve would cut rates 25 basis points. But Chairman Powell’s statement, that they had no intention of continuing with another cut at the FOMC’s December meeting was not what the market wanted to hear. Bitcoin ended the week at $105,591, which was neither entirely bullish nor reassuring for bulls.
The Key Levels of Support and Resistance Now
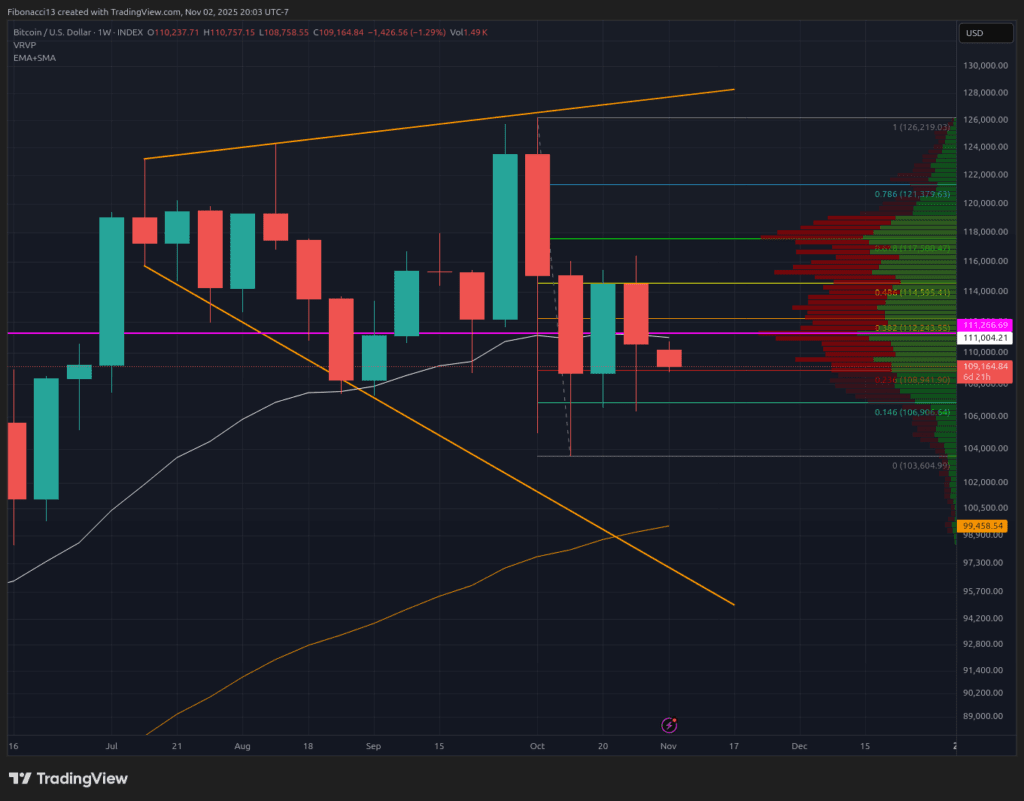
The support level at $106,900 held last week again, and the Fibonacci Retracement of 0.146 was a good bounce for bulls Thursday through the Sunday close. The bulls don’t want to see this support level tested in the future, because it is more likely to fall on its next attempt. It is likely that losing this level will result in a loss of $100,000, and also a test for long-term support. The potential for support is $104,000. However, this has been tried twice before, and it will be difficult to maintain this support level.
Bulls will have to break through additional resistance levels created by the bearish action of last week. The price closed below the 21 EMA last week, and is now hovering around $111,000 for this week. A point of control is shown in the volume profile at $111,000, as well. The next level of resistance will be $114.600 if price can climb over $111,000 If the price closes above $114.600, it opens the door to $122,000 for the bulls.
This Week’s Outlook
Bitcoin will likely break the support this week to the downside unless strong buyers step in with a large volume of purchases. The $106,900 level will likely be broken if prices start to drop below $108,000. The $104,000 support should be broken if the price starts to close below $108,000. However, if this doesn’t last long, $96,000 is likely going to become the new level of support. As the daily chart appears very bearish, bulls are likely to need a macro-catalyst this week in order to avoid lower prices. It appears that bitcoin will fall below $106,900 on Monday.
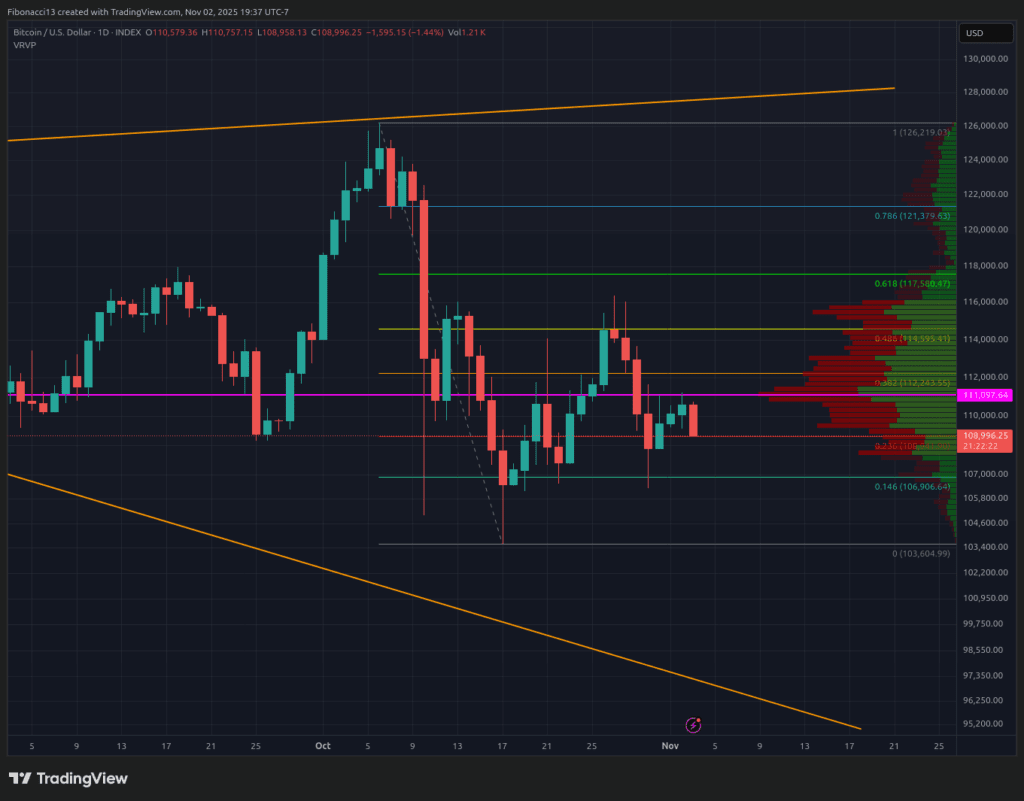
Market mood Bearish – The bulls’ hopes were beaten back this week when the price failed to hold above the $115,500 resistance level. Bulls must still take down some resistance levels above to turn the bias in their favour.
Next few weeks
Bitcoin will likely take a step back in the future as Nasdaq’s price movement takes center stage. If the Nasdaq keeps correcting lower in the coming weeks, it will be difficult to maintain any upward movement. Bitcoin bulls are hoping that the Nasdaq resumes its upward trend to support them. Bulls are also looking forward to the Consumer Price Index due for release on November 13 for any improvement over last month’s lackluster inflation figures. The Federal Reserve will likely cut interest rates again in December if inflation is cooler. The bears will remain in charge for the near future unless the bulls receive a great deal of assistance.
Terminology Guide:
Bulls/Bullish: Investors and buyers who expect the price of the stock to rise.
Bears/Bearish: Expecting the price of the stock to fall.
Support or level of support: Support is a level where the asset’s price will initially be held. Support becomes weaker the more it touches the asset, and it’s more likely to not hold its price.
The level of resistance or the degree of resistance: The opposite of support. Initial price level likely to cause the rejection of the price. Resistance becomes weaker the more it touches the resistance.
EMA: Exponential moving average. Moving average which gives more weight to the recent price than the earlier prices. This reduces the lag.
Fibonacci Extensions and Retractions: These ratios are based on the so-called golden ratio. This is an universal ratio that relates to cycles of growth and decay in nature. Golden ratio based on constants Phi (1.618) and phi (0.618)
Volume Profile This indicator shows you the amount of transactions at a specific price level. This indicator has a point of control, or POC. It is a horizontal bar that indicates the level of price at which there was the most volume.
“This article is not financial advice.”
“Always do your own research before making any type of investment.”
“ItsDailyCrypto is not responsible for any activities you perform outside ItsDailyCrypto.”
Source: bitcoinmagazine.com


