


Bitcoin (BTC) started a new week in fighting form as bulls staged a rebound past $111,000.
-
BTC prices improved as the week closed, giving hodlers some relief. Are we about to see a squeeze on shorts?
-
Longer timeframes raise questions regarding the strength of the bull.
-
US CPI data will be provided to the Federal Reserve on Friday, despite the government shutdown.
-
Leverage is recovering, and traders aren’t betting on large price increases.
-
The future of bitcoin dominance is at stake as altcoins remain sidelined.
Spotlight on BTC price “upside imbalances”
Bitcoin flipped volatile into Sunday’s weekly close, capping the week at $108,600 before briefly retracing.
Data from Cointelegraph Markets Pro and TradingView showed buyer strength resurfacing into the week’s first Asia trading session, allowing a jump to $111,000.
Traders now see volatility as all but guaranteed to continue in the coming days.
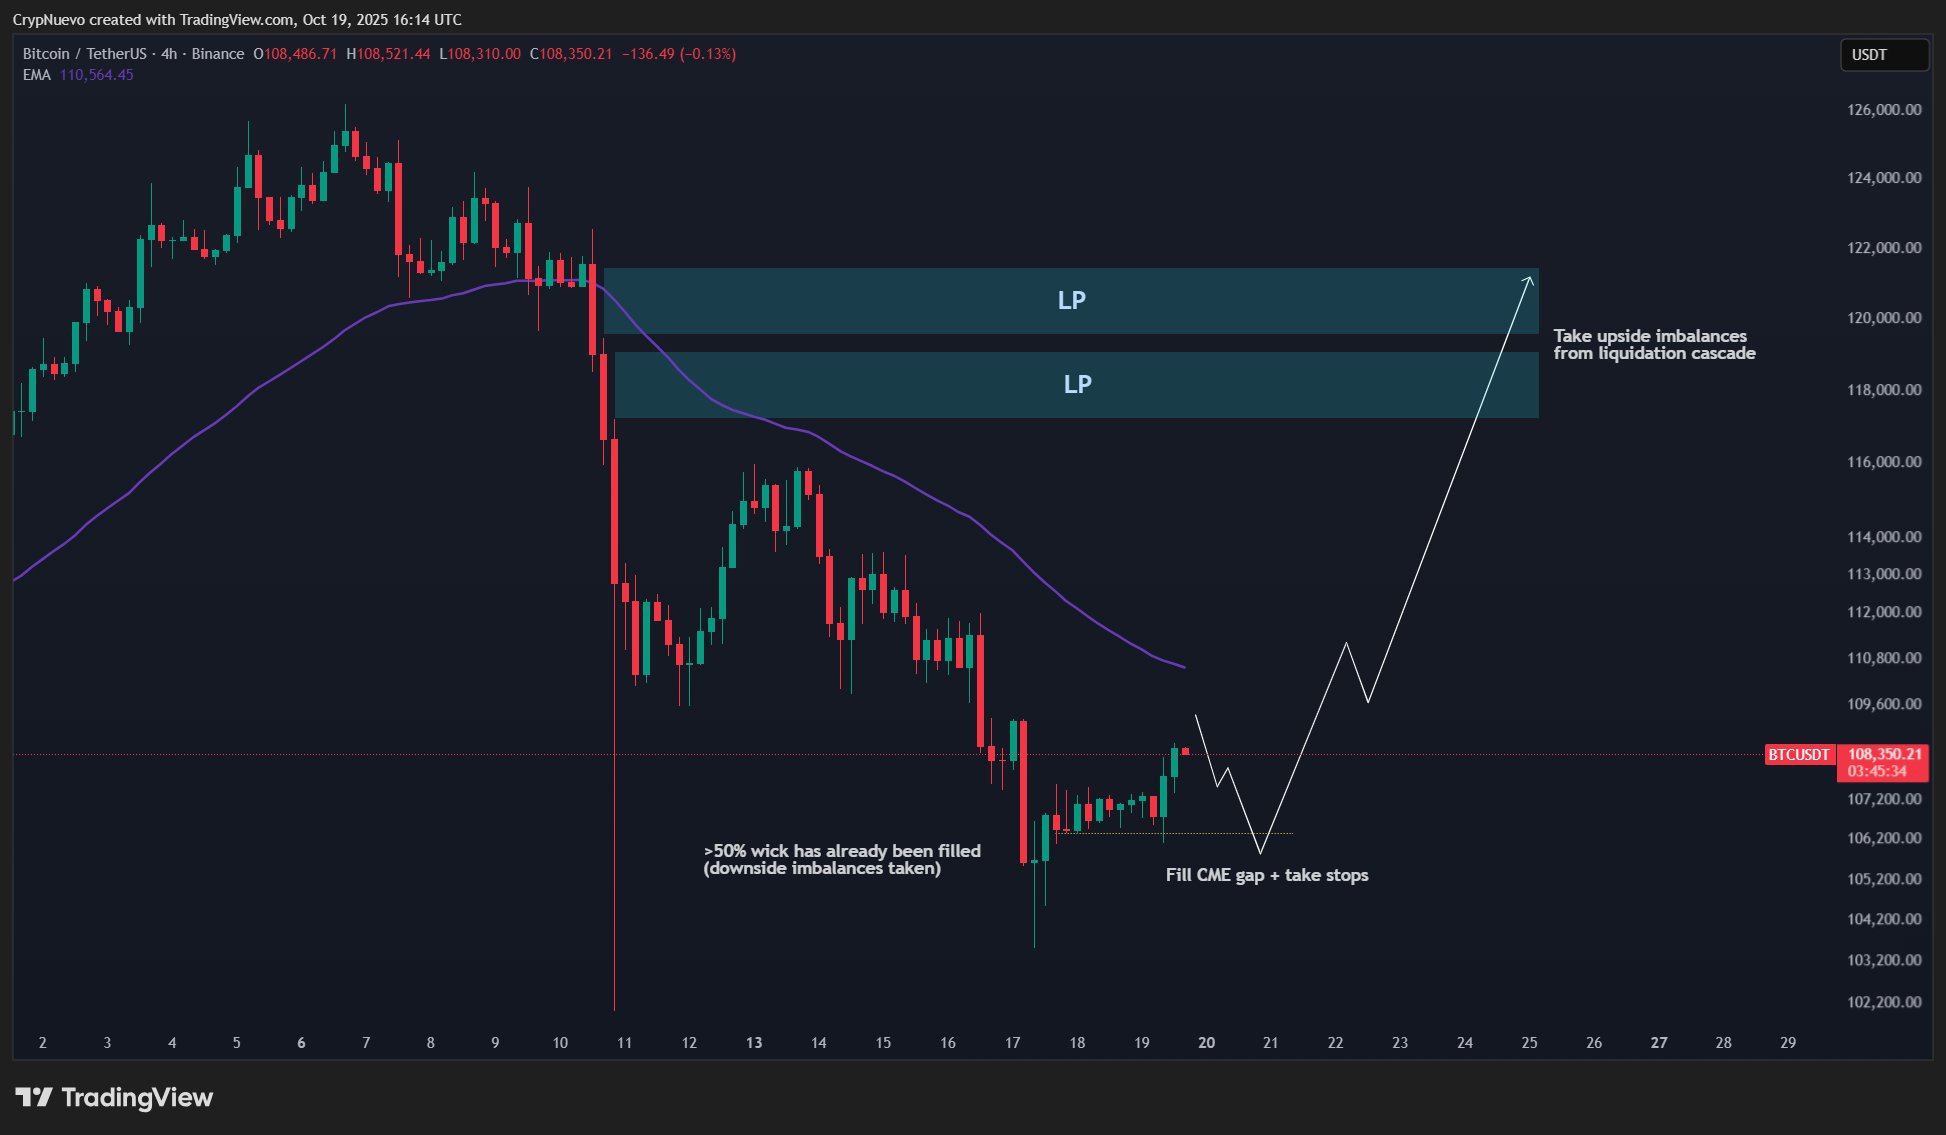
In a dedicated outlook post on X, trader CrypNuevo suggested that a short squeeze may characterize the rest of October.
“Now, we can see a big cluster of short liquidations between $116k-$117k. Short squeeze coming?” He asked the question alongside a graph of order book liquidity.
CrypNuevo said that “upside imbalances” were the target to watch going forward.
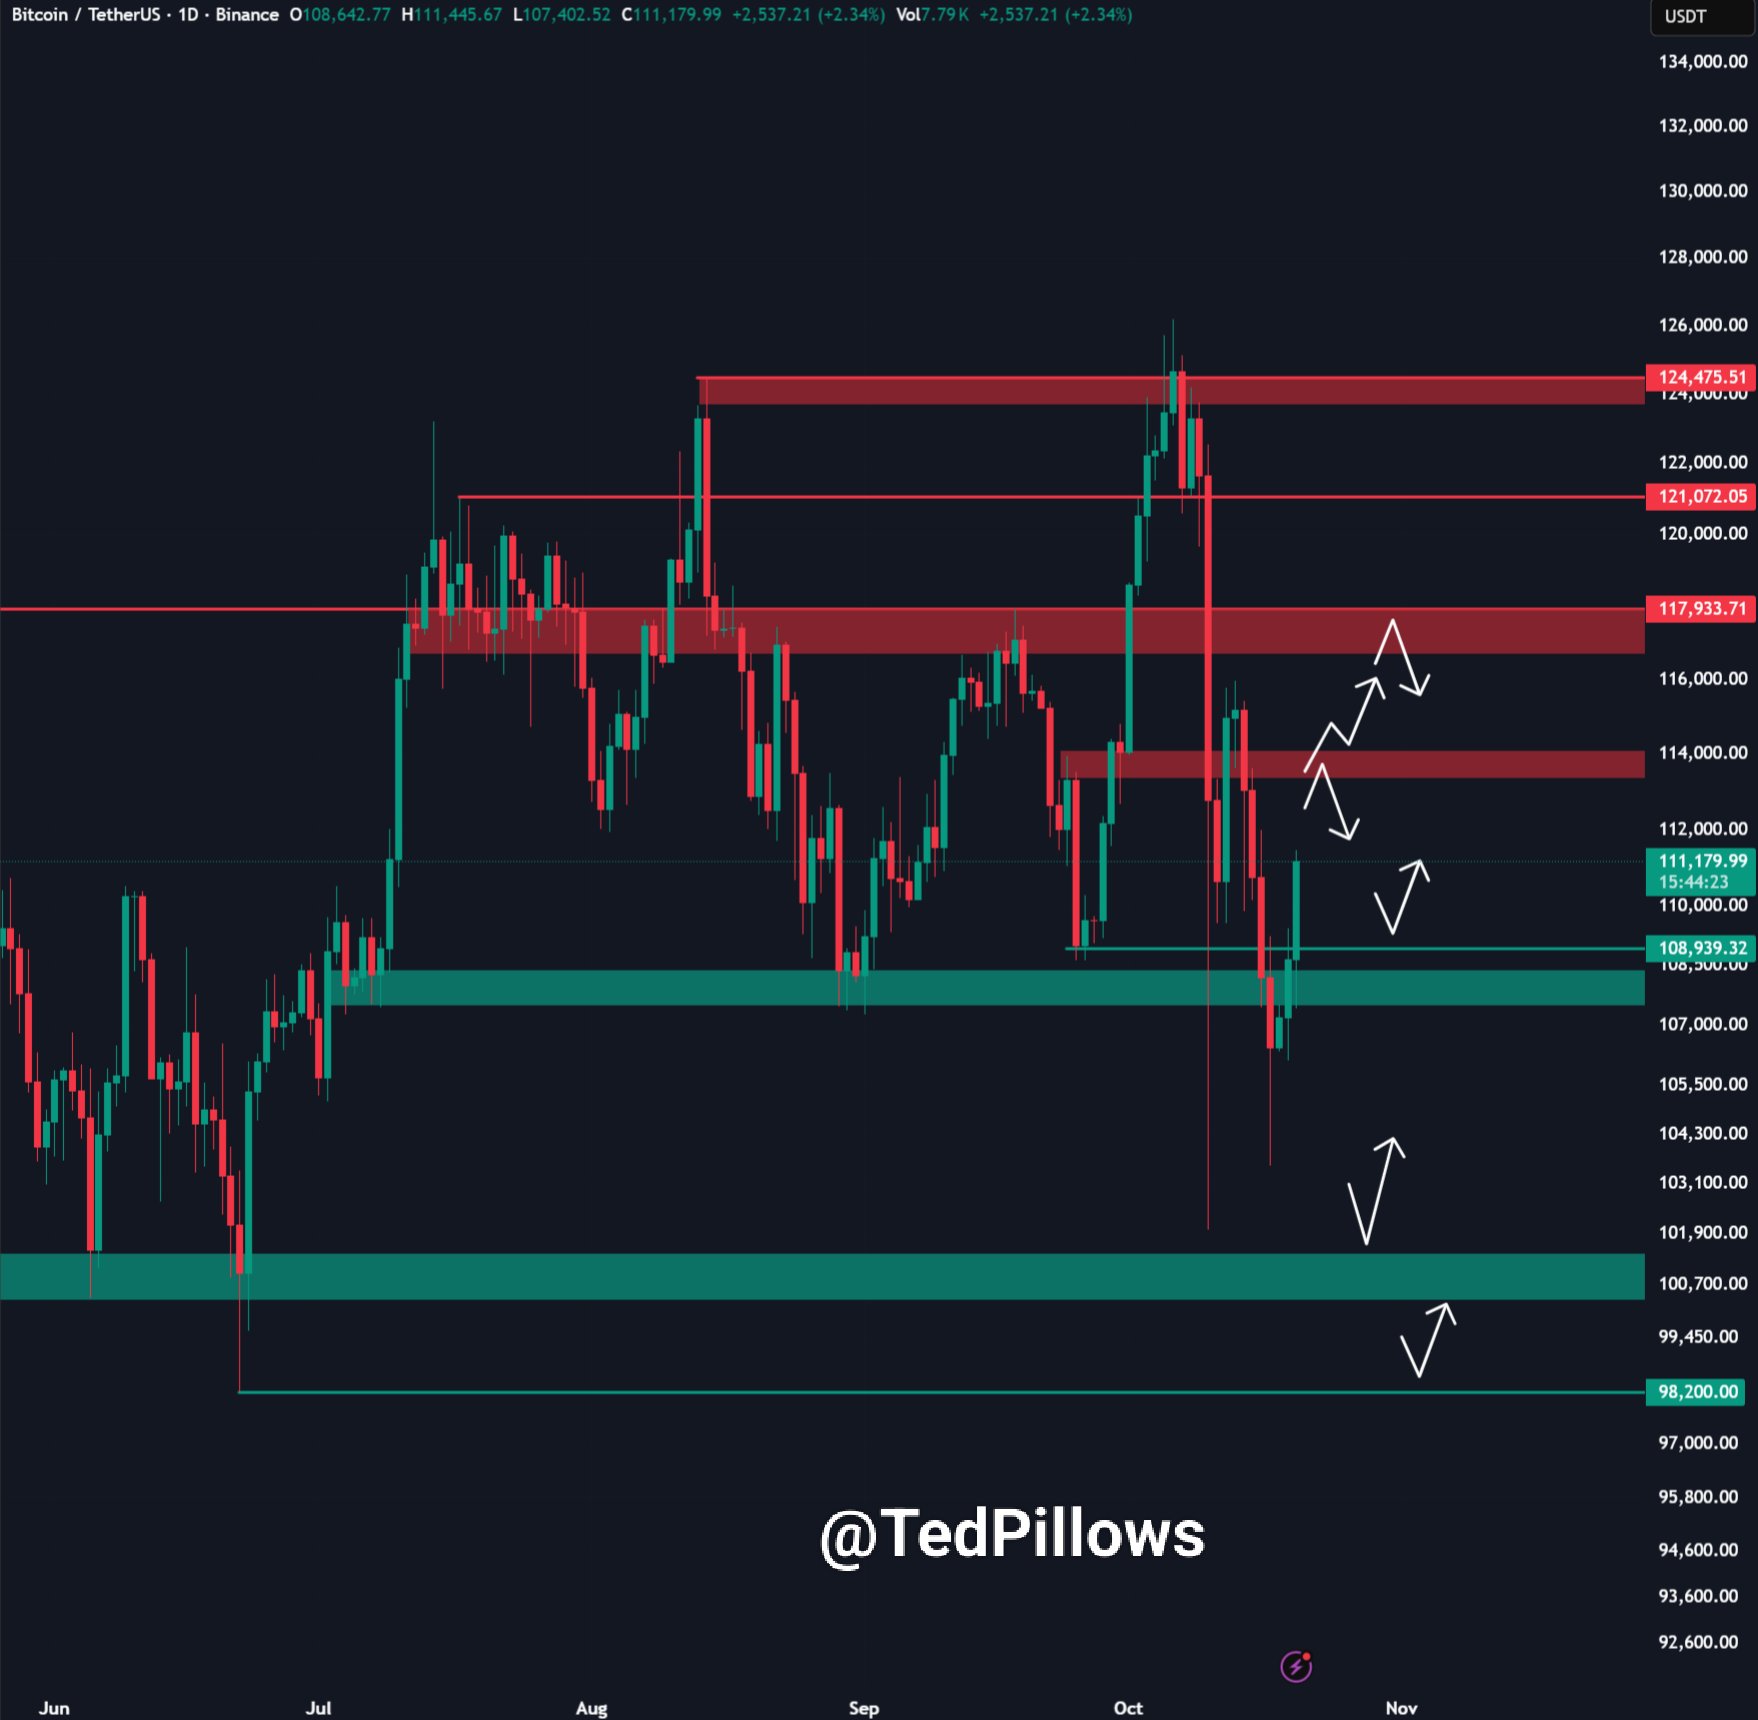
Crypto investor and entrepreneur Ted Pillows earmarked $112,000 as an important reclaim level.
“With US-China trade tensions easing, I think BTC could rally more from here,” he told X followers.
As ever, attention was on gold and Bitcoin’s potential to follow it to new all-time highs. XAU/USD consolidated for the day, after reaching a new record of $4.380 an ounce last Friday.
“Gold has been on an absolute tear this year. BTC has been lackluster,” trader Daan Crypto Trades wrote while looking at the Bitcoin to gold ratio.
“Especially if Gold cools off for some time, we could see some of that capital flow back into more riskier assets. Equities would be the main beneficiary. Bitcoin & Crypto would likely take a small piece of the pie as well.”

Bitcoin’s $102,000 Binance wick stays unfilled
Bitcoin still has plenty of bearish predictions following it as the Oct. 10 meltdown casts a long shadow over some traders’ market view.
Among them is trader Roman, who has been vocal about Bitcoin’s fundamental lack of strength in recent months.
BTC/USD’s volume is declining, according to him, despite the fact that it reached new record highs. Relative strength index (RSI) values on longer time frames also indicate a bearish divergence is unfolding.
$BTC 1M
– Record high MACD
– Bear divs RSI/MACD
– Low volume + price up (bullish Price action exhaustion)
– Momentum loss
– Record high Profit takingBetter to be safe than sorry here and take profits on long term positions. The bull market won’t be around for much longer. pic.twitter.com/bKbdDydjG6
— Roman (@Roman_Trading) October 13, 2025
Now, a potential rebound — even as high as $118,000 — could end up as a head and shoulders trend reversal pattern.
“A break of this level would invalidate the possibility & there’s also a chance that this is just consolidation,” he told X followers last week.
As Cointelegraph reported, four-hour RSI produced a bullish divergence following the dive to $102,000 on Binance.
Despite this, expectations remain that the market will ultimately drop to “fill” that daily candle wick.
“All I see is a bearish retest and volume going down on this small move up proves that theory,” Roman wrote about the latest price move above $111,000.
“Still need to fill that wick!”

CPI due despite US gov’t shutdown
The coming week features a rare macroeconomic event that is already sparking excitement among commentators.
Amid the ongoing US government shutdown, Friday’s release of the Consumer Price Index (CPI) — a key inflation gauge — will go ahead.
“Something unusual is happening this week: On Friday, we are receiving CPI inflation data DURING the US government shutdown,” trading resource The Kobeissi Letter wrote in an X post on the topic.
Kobeissi stated that the Friday CPI would be released for the first time since 2018.
Five days after this release, the Federal Reserve will convene to make a decision on changing interest rates.
Officials pay particular attention to macro-data prints that are published in advance of each meeting. The stakes were higher this time than any other because of the government shutdown, which has caused the delay in publishing the majority of inflation statistics.
“The Labor Department has said that NO OTHER releases will be rescheduled or produced until the shutdown ends,” Kobeissi added.
“This comes during a highly pivotal time for the Fed as they debate whether to continue rate cuts or not. This is drawing speculation of a ‘bullish’ September CPI report.”

A lower-than-expected CPI print would boost risk assets, as it increases the odds of a rate cut, something that would, in turn, boost liquidity inflows later. The latest data from CME Group’s FedWatch Tool shows that markets already expect a 0.25% cut on Oct. 29.
US-China’s trade war is one potential disruption. Markets remain especially sensitive to comments from President Donald Trump regarding a possible trade deal, or lack thereof, with Beijing.
Crypto risk-taking gradually returns
Leverage is creeping back into the crypto market, new data shows, as traders digest the impact of the earlier $19 billion rout.
CryptoQuant’s latest data shows that Bitcoin leverage began to rebound almost immediately following the October 10 liquidation cascade.
“After a sharp decline in mid-October, the index began to rise again last week, from lows near 0.148 to around 0.166 by the end of the period,” contributor Arab Chain wrote in one of CryptoQuant’s Quicktake blog posts on Monday.
“This gradual increase indicates a return of leveraged activity in the market. The slight uptick suggests that some traders have started reopening their leveraged positions amid a modest improvement in overall sentiment, especially following the halt of the large liquidation wave that occurred earlier.”

Arab Chain said that the slow addition of leverage reflects a more “cautious” trader mentality, but also that expectations of significant price increases are limited.
“A continuation of this trend in the coming days could signal a gradual restoration of confidence—especially if the price continues to hold above the $110,000 support level,” It concluded.
As Cointelegraph continues to report, leveraged trading has produced many high-profile casualties, including the now infamous trader James Wynn, who scored his latest $4.8 million losing bet last week.
Make or break moment for Bitcoin dominance
Bitcoin’s share of the overall crypto market cap is back in focus as traders grow increasingly impatient.
Related: Bitcoin’s next rally will start once OGs finish selling: Analysts
After October’s volatility, which cost altcoins significantly, Bitcoin market dominance has steadied, but trouble looms overhead.
“Bitcoin Dominance has fully confirmed a loss of its Macro Uptrend, validating a new Macro Downtrend,” trader and analyst Rekt Capital wrote alongside an accompanying chart Thursday.
“Bitcoin Dominance has indeed turned both the Uptrend (light blue) and 60% (black) into new resistances. In fact, the ~64% level is also figuring as new resistance.”

Dominance measured 59.6% at the time of writing, having spiked to 63.5% on Oct. 10. As Cointelegraph reported, market analyst Rekt Capital sees the area around 70% as classic trend reversal territory.
“Having turned these old supports into new resistance, it looks like Bitcoin Dominance is ready to embark on a new Macro Downtrend over time. The condition for this is that those levels continue to act as resistance on any limited upside that BTCDOM may muster in the interim,” He explained.
“And going forward, it is likely that losing the green 57.68% level as support is what would kickstart a major Altseason.”

As a testament to the severity of the altcoin drawdown, a basket of Binance’s top 50 altcoin futures remains below levels seen before the 2022 crypto bear market bottom.
This article does not contain investment advice or recommendations. Every investment and trading move involves risk, and readers should conduct their own research when making a decision.
“This article is not financial advice.”
“Always do your own research before making any type of investment.”
“ItsDailyCrypto is not responsible for any activities you perform outside ItsDailyCrypto.”
Source: cointelegraph.com


