


In his recent technical analysis Christopher Inks a well-known figure in the crypto analysis field, pointed out that the possibility of the formation Bitcoin is showing a double bottom Adam and Eve pattern. This formation can be seen on the BTC/USD 1 hour chart, and it has an important impact on Bitcoin’s price in the short term.
Bitcoin is shown on the chart with two distinct peaks and troughs. The first trough is known as “Adam,” This bottom is V-shaped, and indicates a price drop that was rapid, followed by an equally quick rebound. Then comes a wider, rounded and gradual upward trend. “Eve” Trough: A slower, more deliberate recovery of prices.
Bitcoin reaches its highest level
Inks claims that the yellow horizontal line is the neckline for the pattern. The pattern would be confirmed by a breakout above the neckline and confirming a possible upward trend. bullish reversal. This neckline is important, as it lies at around $67,000, and represents an important resistance level that must be overcome for the pattern to become confirmed.
Inks calculates the pattern target by measuring the distance between the Adam’s trough and the neckline. The breakout point is projected up from this height of 8.88%, indicating that the target pattern would be around $73,000. Bitcoin’s all-time high (ATH).
The chart also includes volume, Relative Strength Index(RSI), Stochastic RSI. The volume, which is shown at the bottom of chart, showed a peak during Adam’s formation, and then a less prominent one for Eve. The volume profile is often associated with the Adam-Eve pattern, and it can be used as confirmation of a bullish mood.
The RSI (a momentum oscillator) measures price changes and their speed. At 47 it is in neutral territory. This means that neither the bulls or bears are completely in charge. Stochastic RSI is a sensitive indicator which combines features of stochastics and RSI. It indicates a strong upward trend with a reading of 95 or more out of 100. This could indicate a potential short-term drop due to conditions that are overbought.
Final note: The Stochastics RSI shows a crossover into overbought, which may sometimes be a precursor to a correction in price. A bullish formation called Adam and Eve indicates that the market is optimistic. Bulls can target $73,780 if BTC breaks through $67,000.
BTC was trading at $63,571 as of press time.
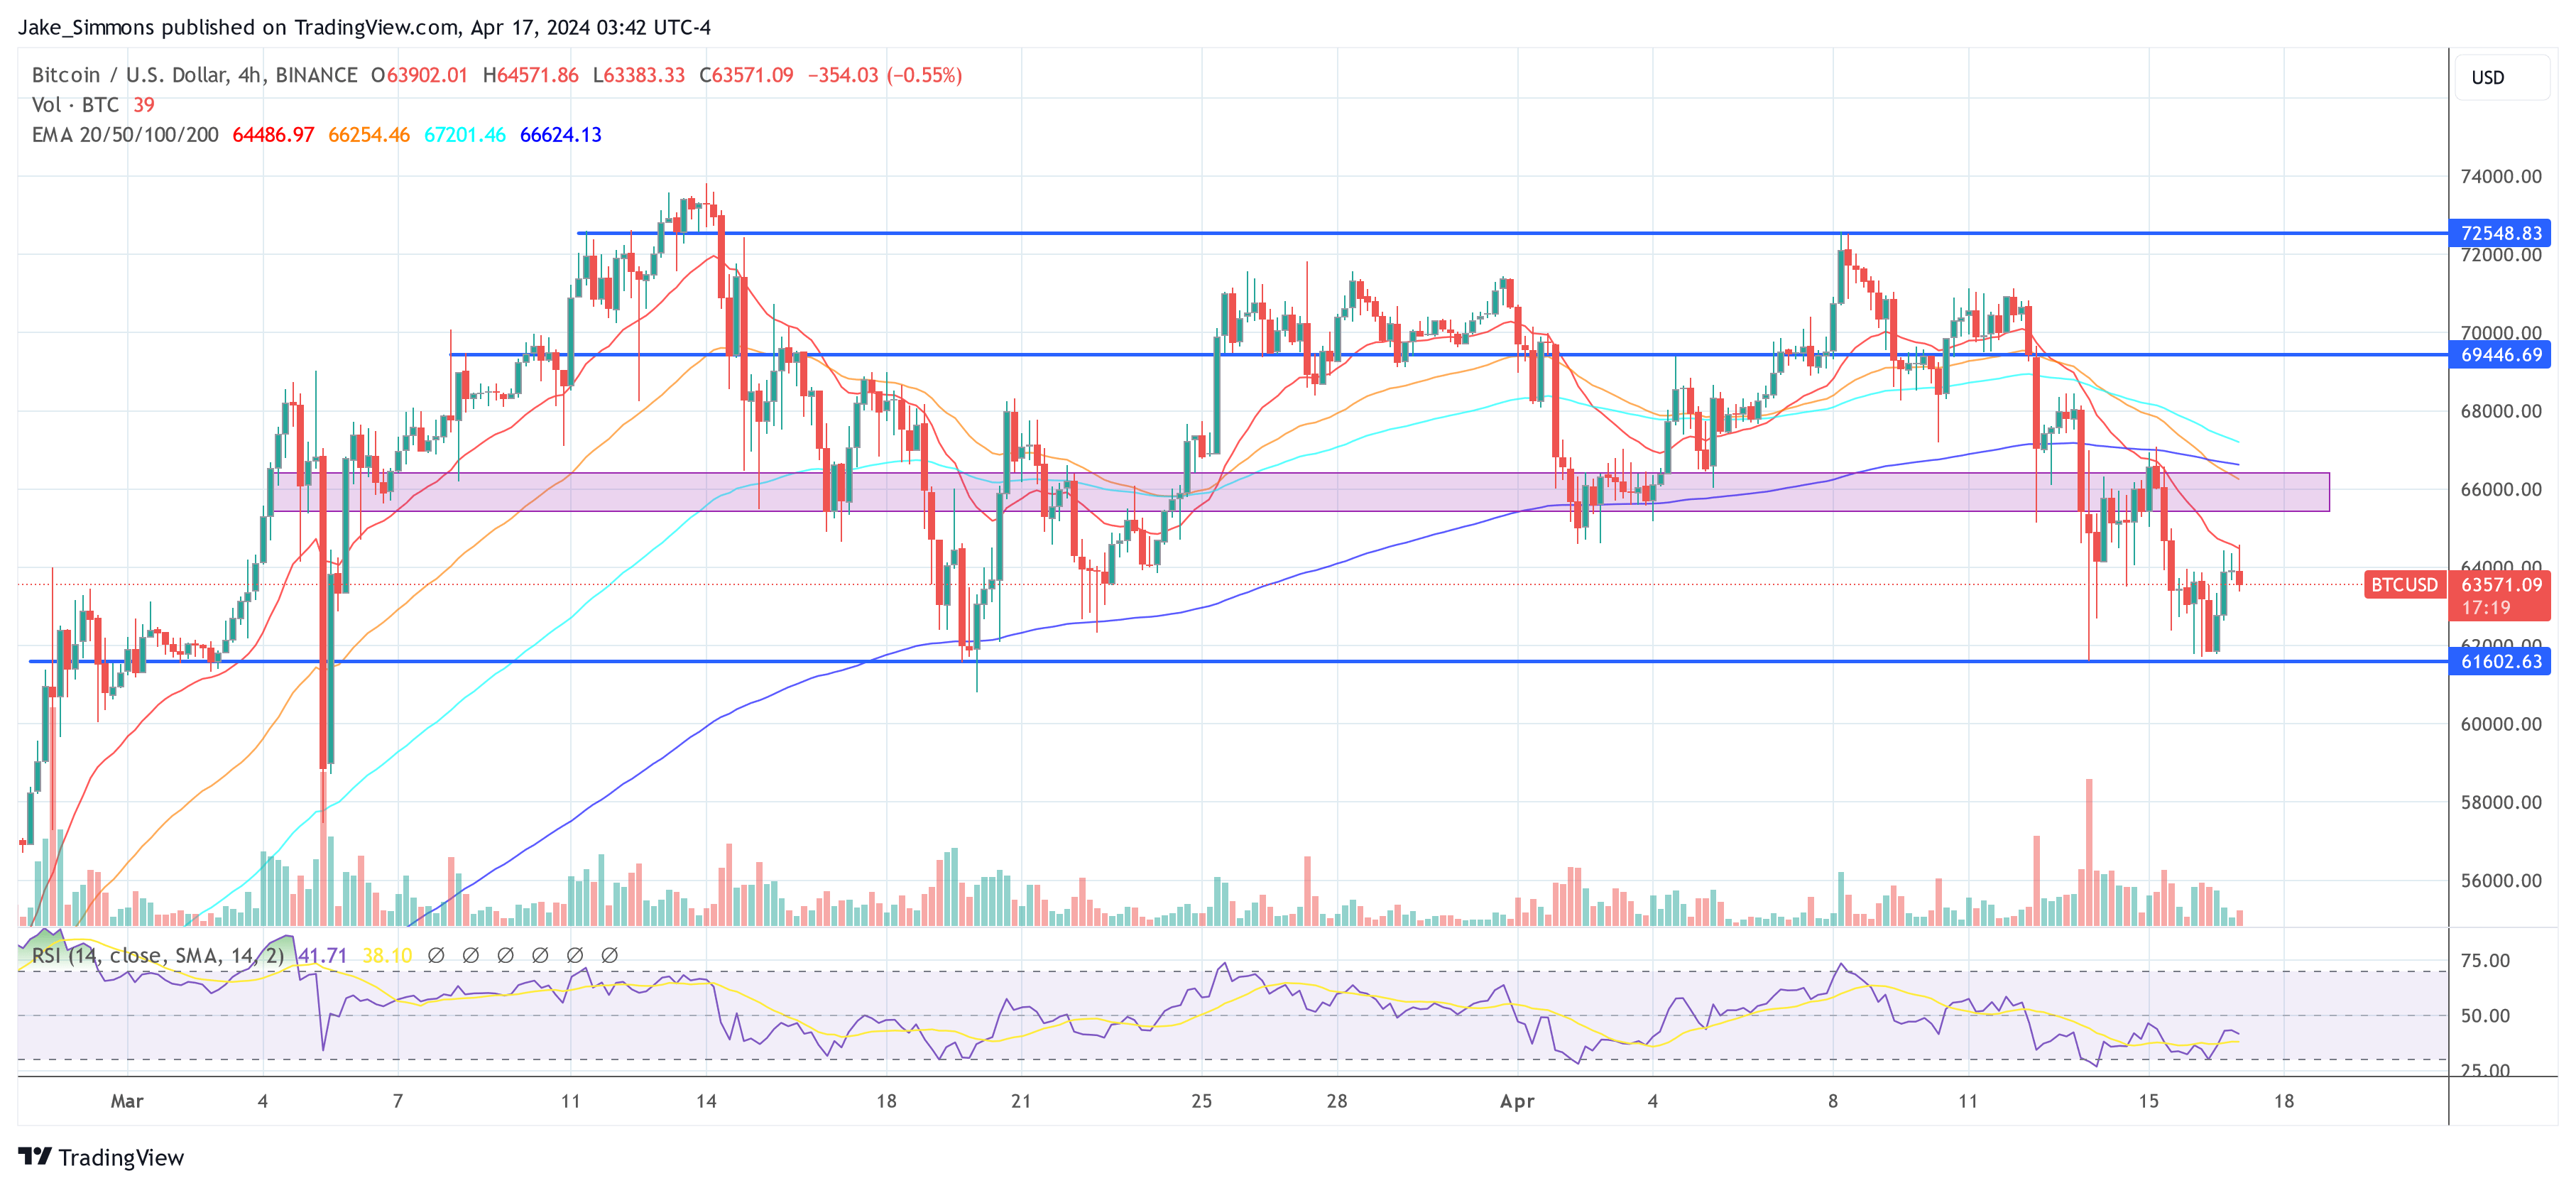
Featured image created with DALL·E, chart from TradingView.com
Disclaimer article This information is only for educational purposes. NewsBTC does not give its opinion on the best way to invest, whether you should buy, hold or sell any investment. Investing is risky and comes with risks. It is recommended that you conduct your own research. own Do your research before you make any investments. You are solely responsible for the use of information on this site. own risk.
“This article is not financial advice.”
“Always do your own research before making any type of investment.”
“ItsDailyCrypto is not responsible for any activities you perform outside ItsDailyCrypto.”
Source: www.newsbtc.com


