


Bitcoin, once again, is at the heart of market turmoil. Trading just above $110,000, many analysts see this as an important demand level. BTC has held this level of support, but volatility is increasing as investors become more cautious and bears intensify their pressure. Market participants are closely monitoring whether Bitcoin is able to maintain its current footing, or if it will undergo a more severe correction.
Related Reading
This uncertainty has been fueled by the recent shift of capital from Bitcoin into Ethereum. Bitcoin enthusiasts have been rattled by this change. Ethereum’s strength and the accumulation of whales have brought BTC into greater scrutiny. This has led to fears about the future dominance of Bitcoin in the cryptocurrency market.
Axel Adler, a top cryptocurrency analyst, highlighted new data that showed a spike in BTC+ETH exchange inflows after Bitcoin hit its all-time record high of $124,000. Stablecoins inflows were significantly lower, indicating that recent increases in supply This was due to the lack of liquidity. The imbalance is often a result of excessive selling and profit-taking.
A Bearish Inflow Ratio for Bitcoin
Adler says that recent Bitcoin weakness is directly linked to the exchange flow dynamics. He points to the Inflow Ratio (BTC+ETH ÷ Stablecoins), a key indicator that measures the balance between major crypto inflows and stablecoin liquidity. Recently, this ratio spiked to 4.0×, coinciding with a wave of selling pressure and a noticeable price pullback. Adler describes this as an example of excess liquidity overwhelming new supply, which has in the past pushed Bitcoin down.
Since then, the ratio has eased to around 2.7× on a 7-day moving average, and inflow volumes of majors have cooled to approximately $5 billion per day. Although this is an improvement over the extremes it shows the inflows for BTC, ETH and stablecoins to be relatively large compared to available capital. There is simply not enough demand to sustain the current upward trend.
Adler believes that Bitcoin is still in a negative setup. Limited buying liquidity keeps rallies at bay. Adler warns however that trends in the crypto markets can be very volatile. The current market imbalance could be reversed by a sudden surge in stablecoin demand or a renewed interest from institutions. The data, however, is bearish for now. It highlights the importance of closely monitoring the exchange flows while BTC negotiates this important phase.
Related Reading
BTC Pivotal Resistance Level Testing
Bitcoin currently trades near $111192. The price has recovered modestly from the volatility of last week that saw it fall below $108,000. Bitcoin has been trying to recover momentum. Its price is hovering above the SMA of 100 days, which represents a green line around $111737. The moving average is now acting as an immediate barrier, and BTC must break above it in order to show strength.
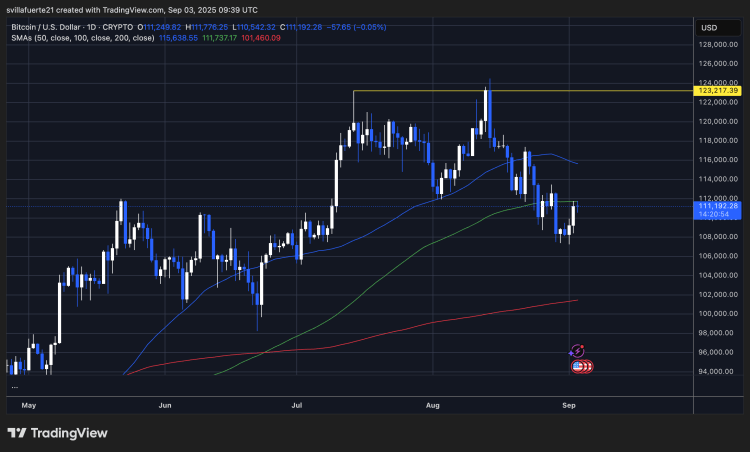
To the upside, the SMA 50 days ($115.638) is the next big barrier. Bulls who manage to break through this barrier will be able to test the $123,217 local high, which is marked as an important resistance line. Bitcoin has been unable to maintain gains over the SMA 100 in recent sessions, which suggests sellers are still active.
Related Reading
Support is at $108,000. A stronger demand will likely be seen around the SMA of 200 days ($101460). BTC could suffer further losses if it breaks below the $108,000 level. The price may even reach the $100,000 psychological mark.
Bitcoin is still in the consolidation phase, trapped between two major moving averages. If momentum turns bullish, a decisive rise above $115,000 will shift the trend back to positive. Failure to maintain current levels could lead to renewed selling pressure. To prevent further decline, bulls need to defend $108,000.
Chart by TradingView. Image: Dall-E.
“This article is not financial advice.”
“Always do your own research before making any type of investment.”
“ItsDailyCrypto is not responsible for any activities you perform outside ItsDailyCrypto.”
Source: www.newsbtc.com


