


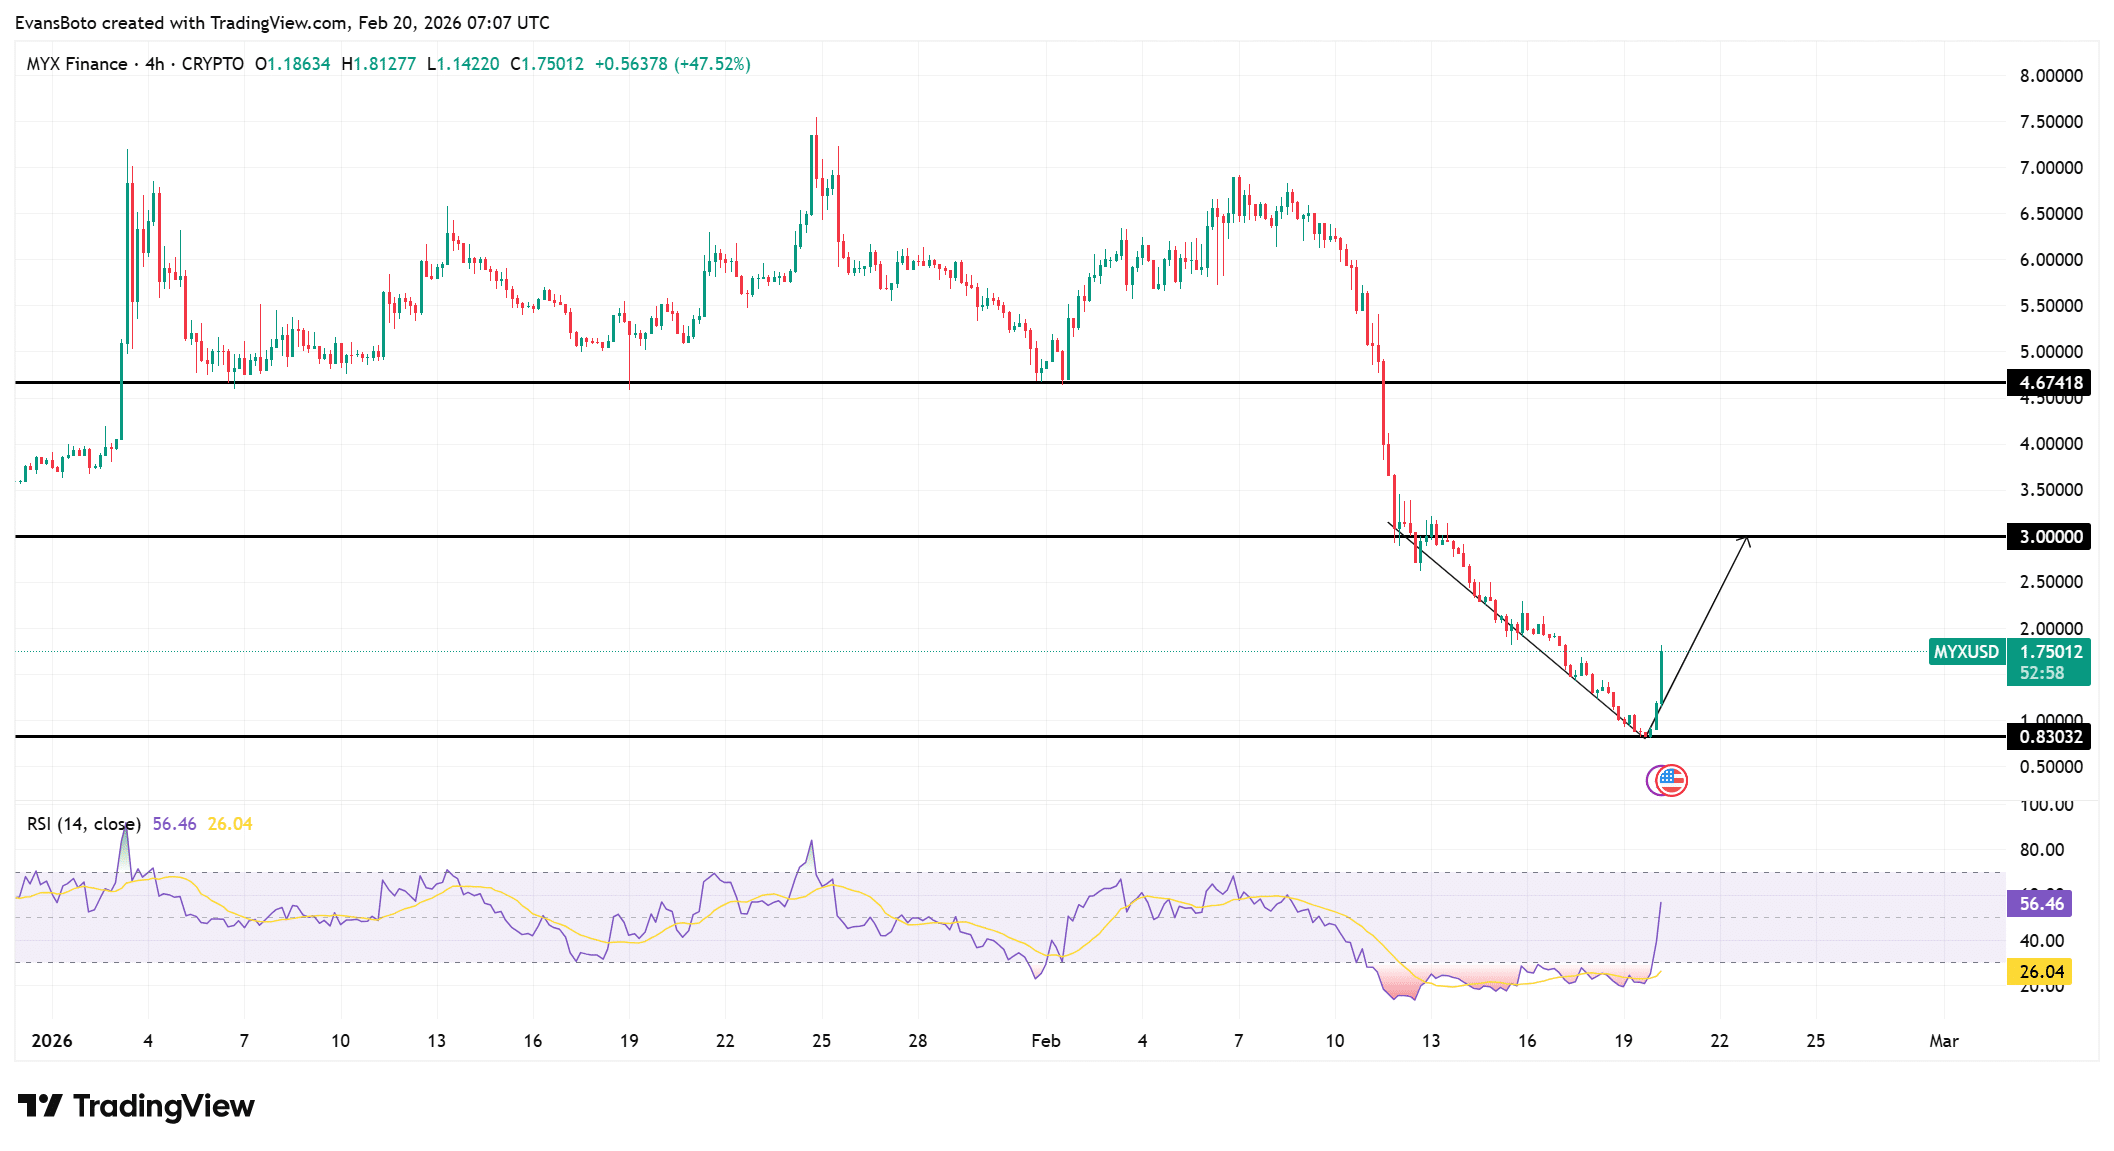
MYX Financial [MYX] As of press time, the currency has surged 83.65% over 24 hours. Trading volume has also exploded 209.35% across major exchanges to reach $405.76 Million. The 4H chart showed a large expansion candle as buyers stepped up their purchases.
The price pushed out from $0.83 and recovered short-term structural support. A portion of the cascading drop was erased by the vertical recovery.
It was not a quiet move, as the participation grew along with price. It is a move that strengthens the credibility of this rally.
The explosive move is often what attracts momentum traders. Volatility could therefore remain high as market participants continue to reevaluate fair value. MYX.
Does MYX have a new bottom of $0.83?
MYX has printed a strong reaction to the macro-support of $0.83 after extending a lower high, lower low sequence on the 4H Chart.
Buyers absorbed this pressure, and in turn forced the candle to expand sharply.
The impulsive movement broke the immediate descending pattern and altered short-term dynamics. The price now hovers at around $1.75, after recovering minor consolidation areas formed during the breakdown stage.
RSI, on the other hand, rebounded to 56 from 26, indicating a strong bounce, and not merely a slight increase in momentum.
Structure now indicates a possible trend change, as the price has established a new low higher than $0.83. This was followed by a solid continuation.
The next significant resistance is $3.00, which remains from the previous breakdown area. The bulls will need to hold higher lows in order to maintain the recovery and avoid a new rejection cycle.
TradingView
Why is the top trader now long?
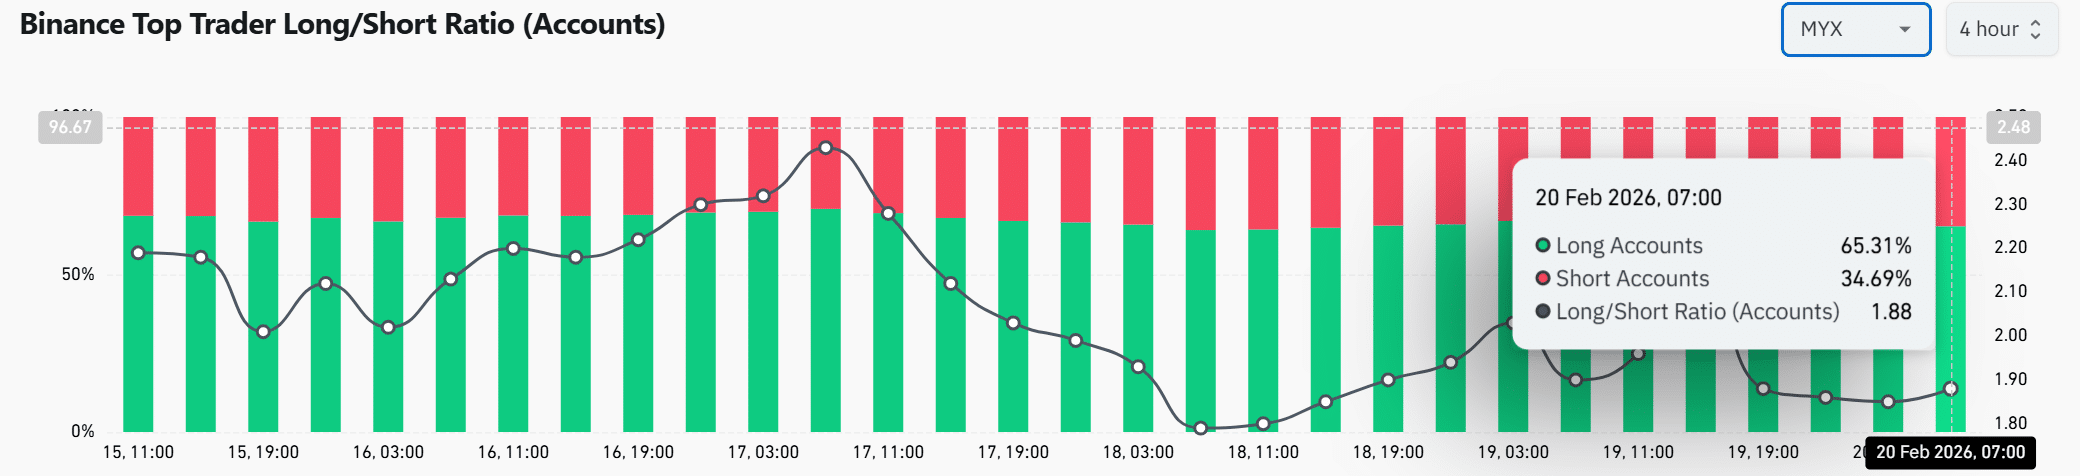
Top Binance trader positions show that 65.31% are long, and 34.69% are short. The Long/Short Ratio was 1.88 at the time this article was written, which indicates a bullish bias.
The growing imbalance in the ratio is a sign of increasing confidence from high-value clients. Additionally, this steady rise in the ratio is aligned with the recent increase in prices.
MYX’s acceleration prompted traders to expand their exposure in the direction of MYX. A heavily tilted portfolio can create volatility, however, if market sentiment suddenly changes.
The data indicates that informed participants are still anticipating further gains. This belief strengthens the bullish narrative emerging on derivatives platforms.
Source: CoinGlass
Increased Open Interest Fuels Leveraged Momentum
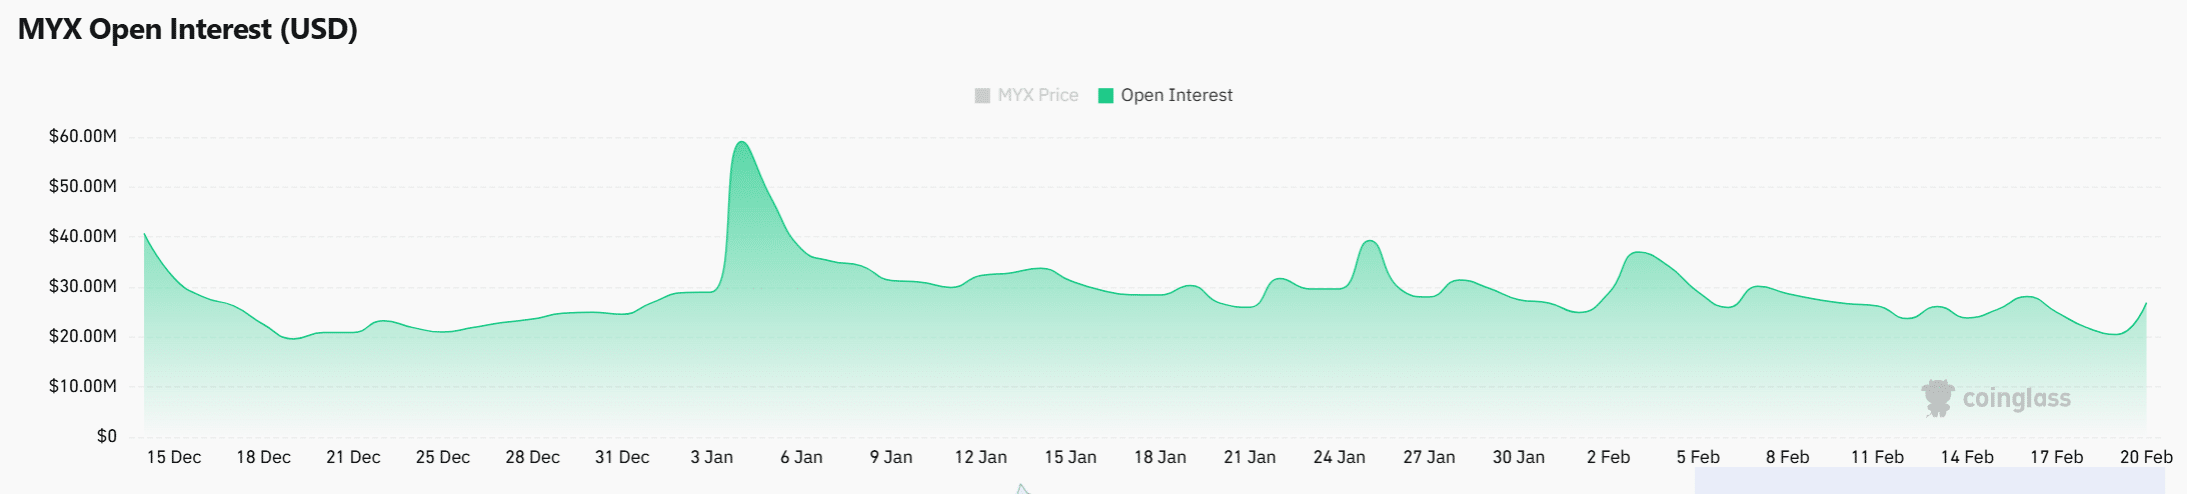
Open Interest (OI), as of the press date, increased by 120.17% in response to this rally. The surge in open interest confirms the entry of new leveraged positions into the market.
Price and OI increasing together are more likely to reflect aggressive, new longs than a simple cover of shorts. This alignment also shows that traders are actively investing capital in the movement.
OI has also grown by a further layer. Volume is already up 209.35%. Leverage can be used to magnify both price and volume swings.
Leverage could increase gains if momentum continues. In the opposite, any drop could cause forced liquidations or sharp intraday fluctuations.
Source: CoinGlass
What is more important: Breakout power or leverage-driven risks?
MYX demonstrates its strength by synchronizing price, volume, RSI and OI.
The bullish belief of the top traders is reinforced by their heavy long positions. However, leverage concentration raises volatility risk.
If the momentum remains above the support level, a continuation upwards toward higher resistance is more likely. Positioning could overheat, resulting in sharp pullbacks.
Final summary
- A strong recovery and momentum are favorable for a continued continuation. But, the risk of volatility near resistance is increased by crowded positions.
- MYX may gradually reverse its trend direction if bulls continue to defend lower lows over reclaimed resistance.
“This article is not financial advice.”
“Always do your own research before making any type of investment.”
“ItsDailyCrypto is not responsible for any activities you perform outside ItsDailyCrypto.”
Source: ambcrypto.com


