


Bitcoin (BTC) starts its first full week of “Uptober” fresh from a new all-time high. What is next for BTC?
-
Bitcoin has set a new high over the past weekend. However, traders anticipate some consolidation ahead of a move to $150,000.
-
BTC price retest target is $118,000 and higher.
-
AI-based BTC’s price prediction tool suggests that classic bull-market gains will take longer to materialize.
-
Federal Reserve officials are likely to provide macroeconomic signals this week, despite the US government’s shutdown.
-
Crypto market sentiment just avoids “extreme greed” with Bitcoin’s move to all-time highs.
$150,000 becomes new BTC price goal
After an unusual weekend all-time high, Bitcoin is consolidating near the top of its historical trading range to start the week.
Data from Cointelegraph Markets Pro and TradingView shows that BTC/USD is trading around $124,000.
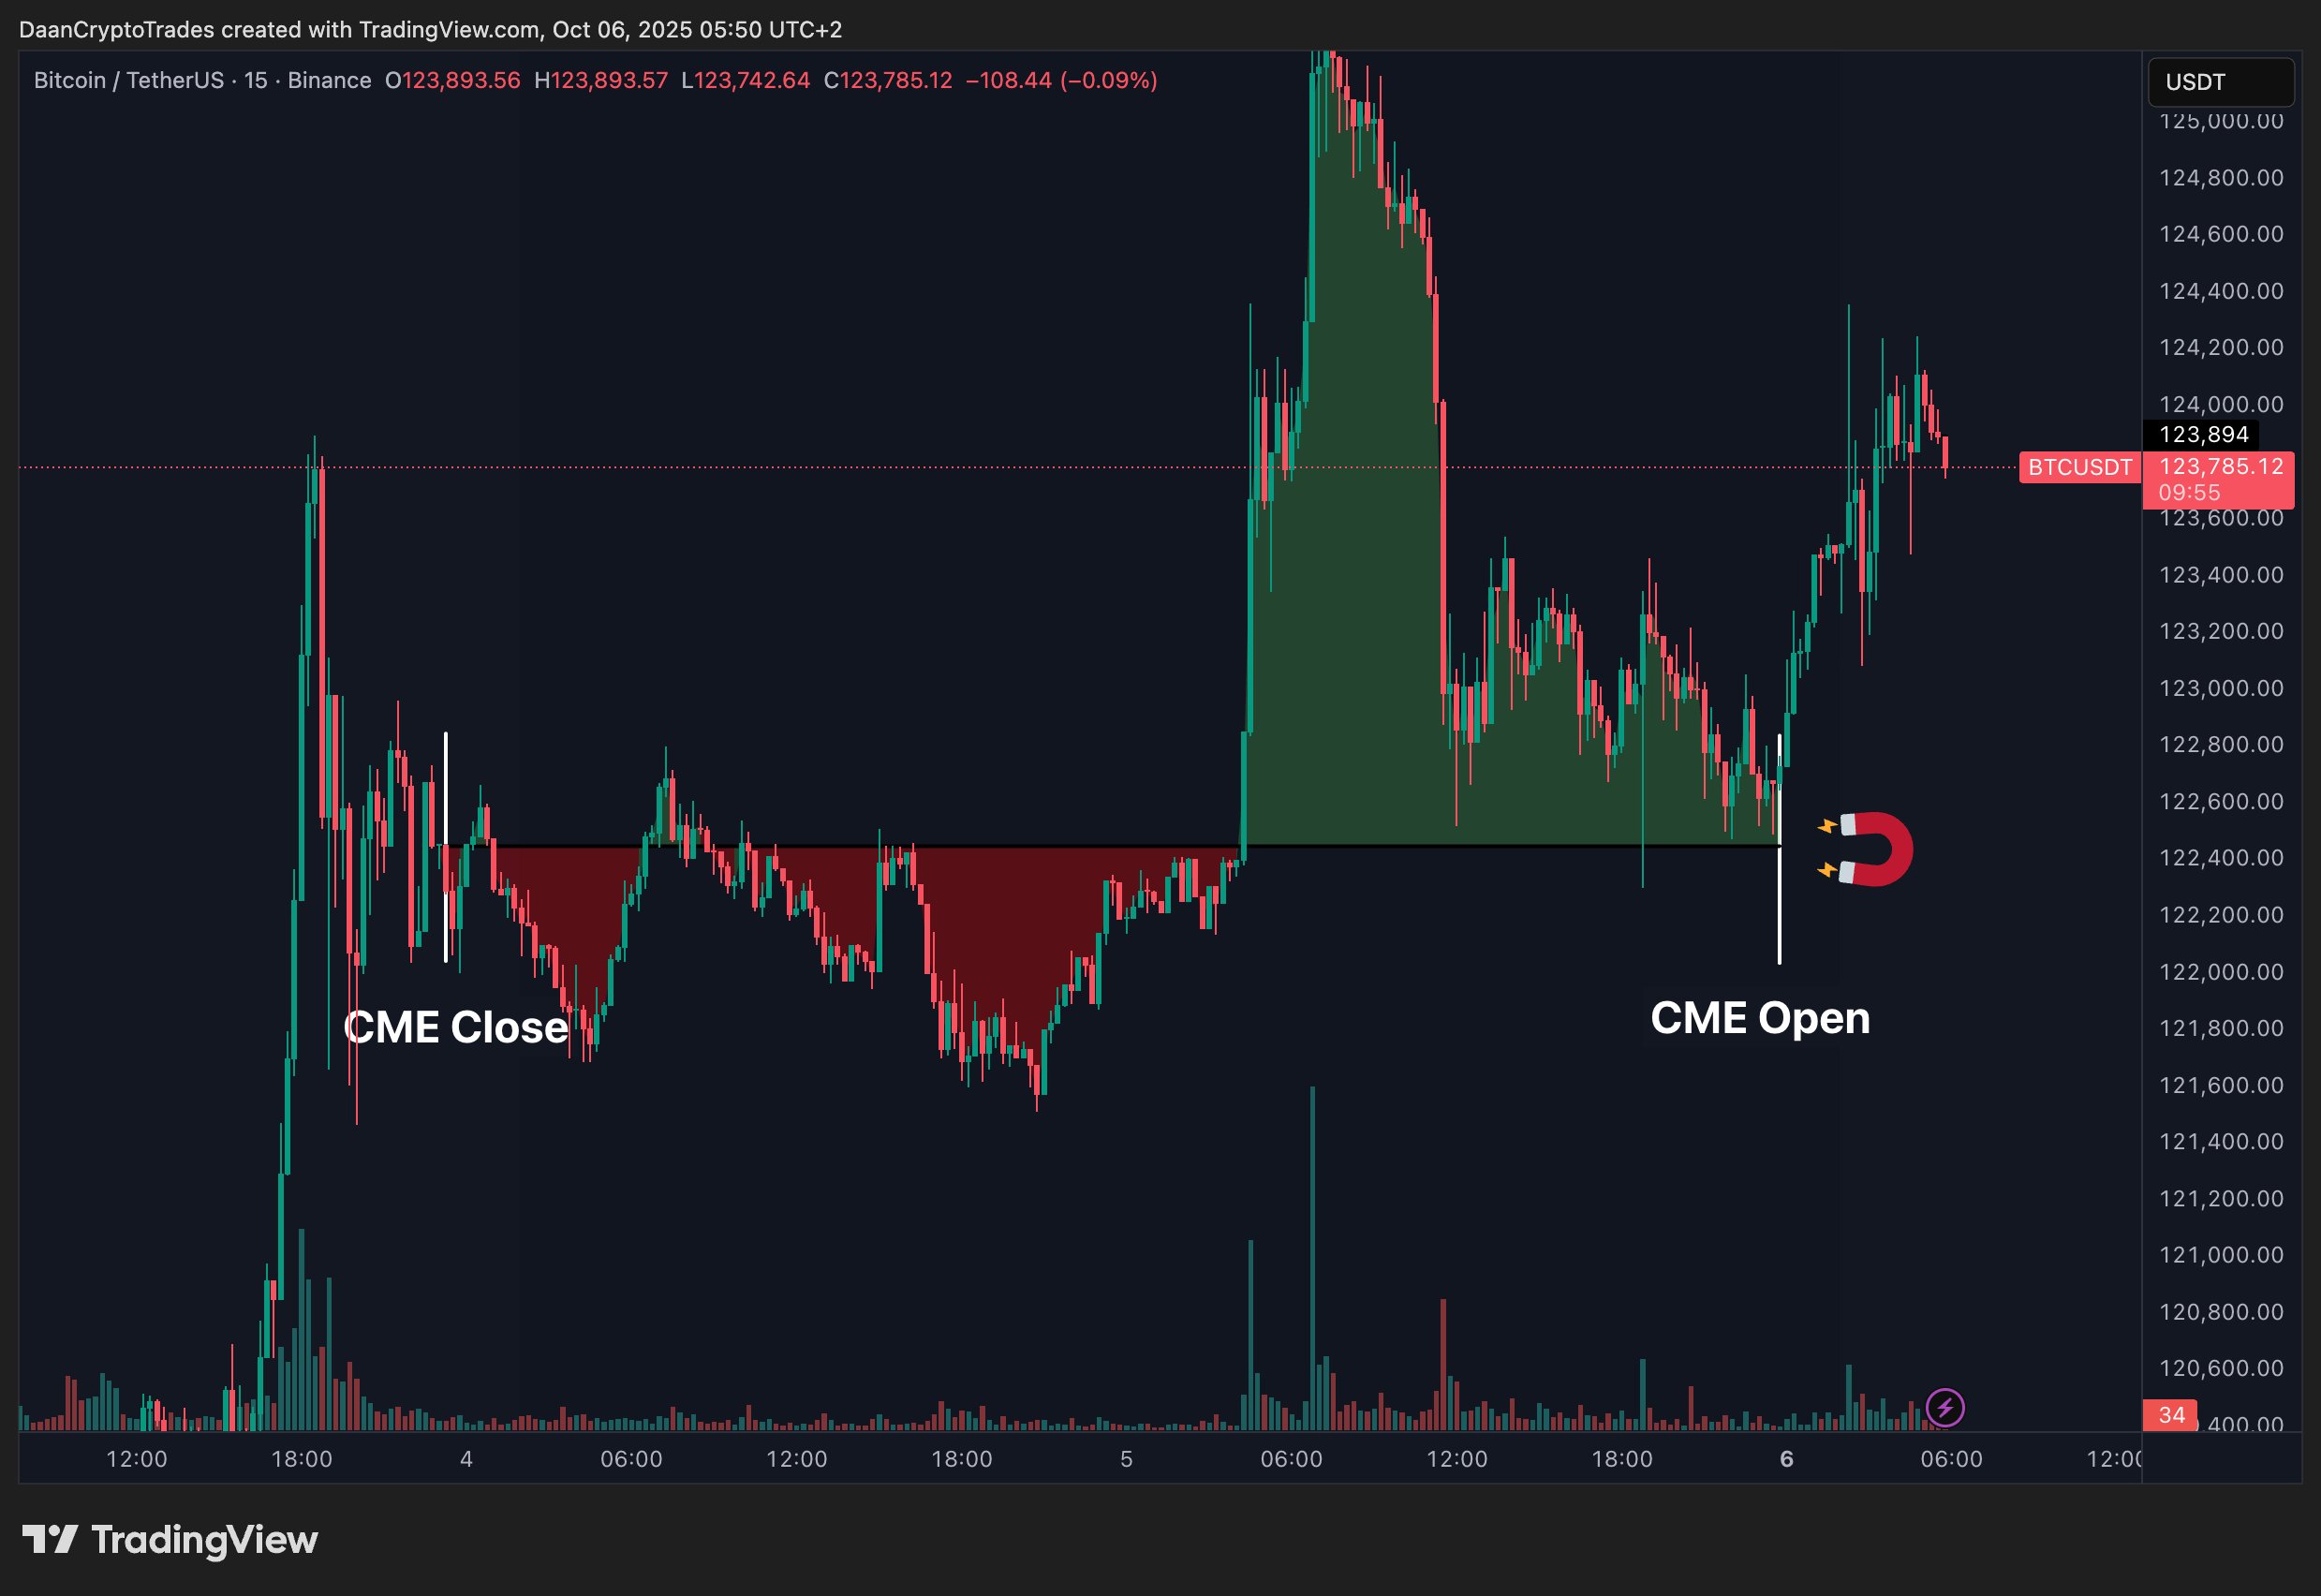
The start of futures trading produced a “gap” that barely appeared before being filled — something trader Daan Crypto Trades described as a “classic weekend squeeze and retrace.”
“Bitcoin did end up making a relatively small gap on the CME futures chart but nothing noteworthy,” he wrote in an X post.
“There’s still the larger gap at $110K from last weekend but I wouldn’t value that until price gets within a few % from it. Especially if this trend keeps going into price discovery, you often see big gaps left behind on both the CME chart & Liquidity levels.”
For fellow trader Crypto Tony, BTC price upside targets hinge on its treatment of $123,000.
Weekly closed above $123,000. Bulls need to maintain this level if they want to sustain their bullishness. pic.twitter.com/Kn0vJ2dxfL
— Crypto Tony (@CryptoTony__) October 6, 2025
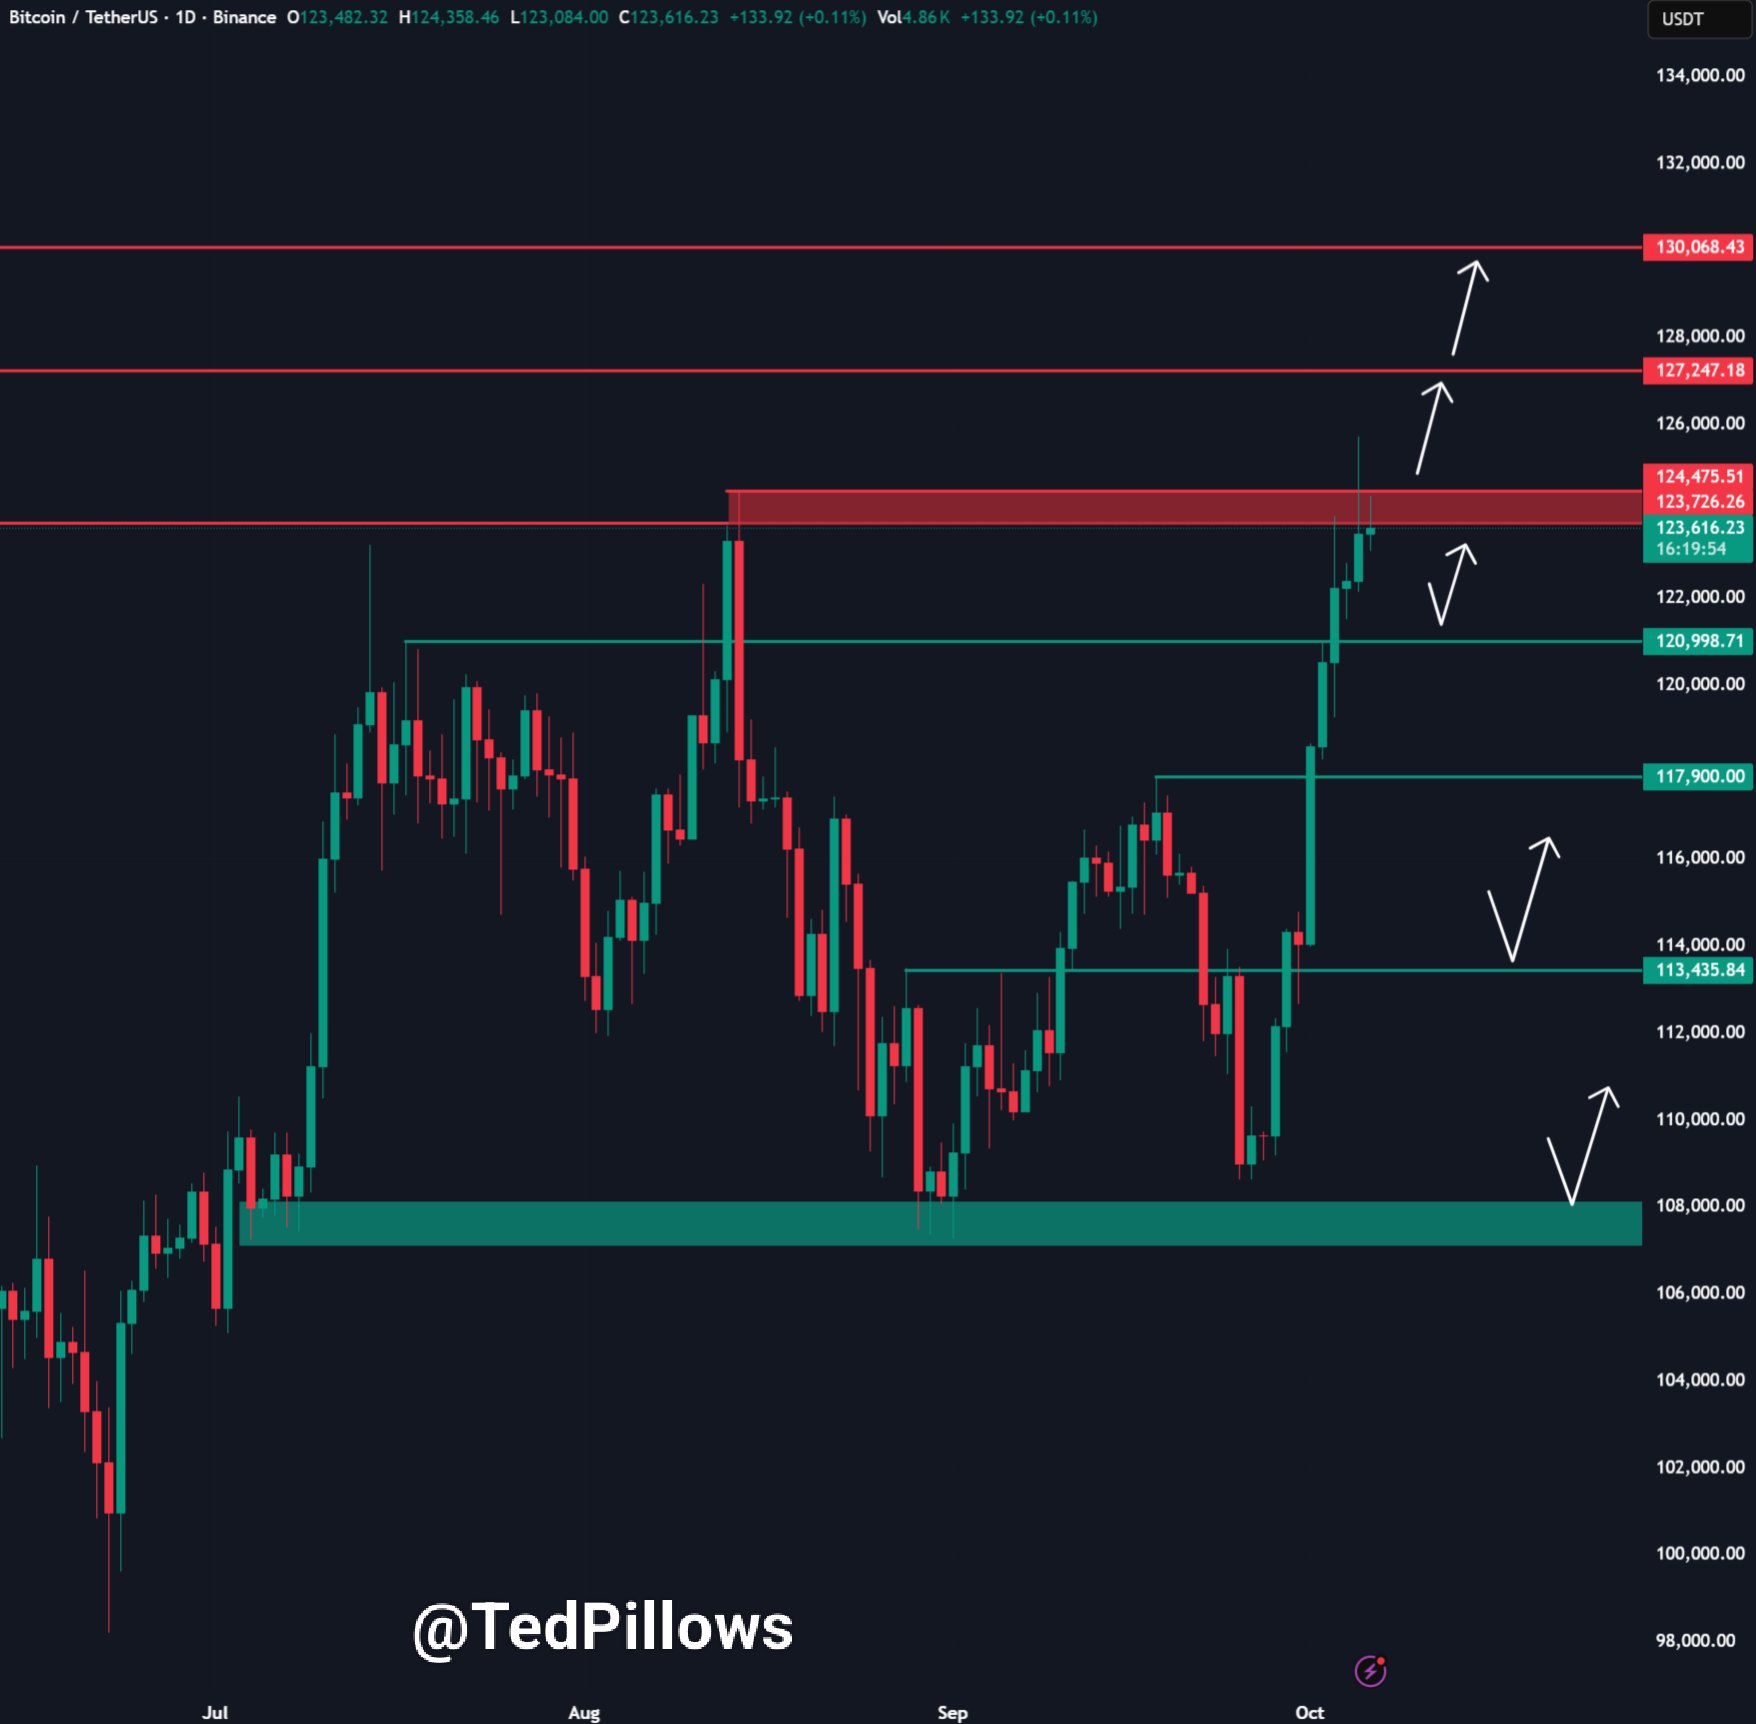
“$BTC has now reached a crucial resistance level,” crypto analyst and entrepreneur Ted Pillows continued.
“Yesterday, Bitcoin pushed above this level, but the move was entirely perps driven. If institutions bid again like last week, a reclaim is possible.”
Zooming out, appetites for higher levels are strong, with Cointelegraph reporting on expectations of $150,000 or more next.
Good morning!#Bitcoin‘s next leg higher has begun, beginning with a newly-adjusted ATH. Also, a weekly high close is being set.
Next goal: $150,000. pic.twitter.com/p5EJqusjDR
— Jelle (@CryptoJelleNL) October 6, 2025
Crypto trader, analyst and entrepreneur Michaël van de Poppe argued that the $150,000 mark should come after a consolidation phase.
“I don’t think #Bitcoin will blast through the ATH in one-go. It needs a little bit of patience, before it should continue moving,” he told X followers on Monday.
“In that aspect, I expect to see a correction and anything beneath $121.5K is a good area to enter before we’ll head to $150K.”
Bitcoin traders eye as much as 4% dip
As Cointelegraph reported, market participants still expect some form of BTC price retracement to occur from record levels.
The bull market does not rise in straight lines, but key support targets are beginning to materialize.
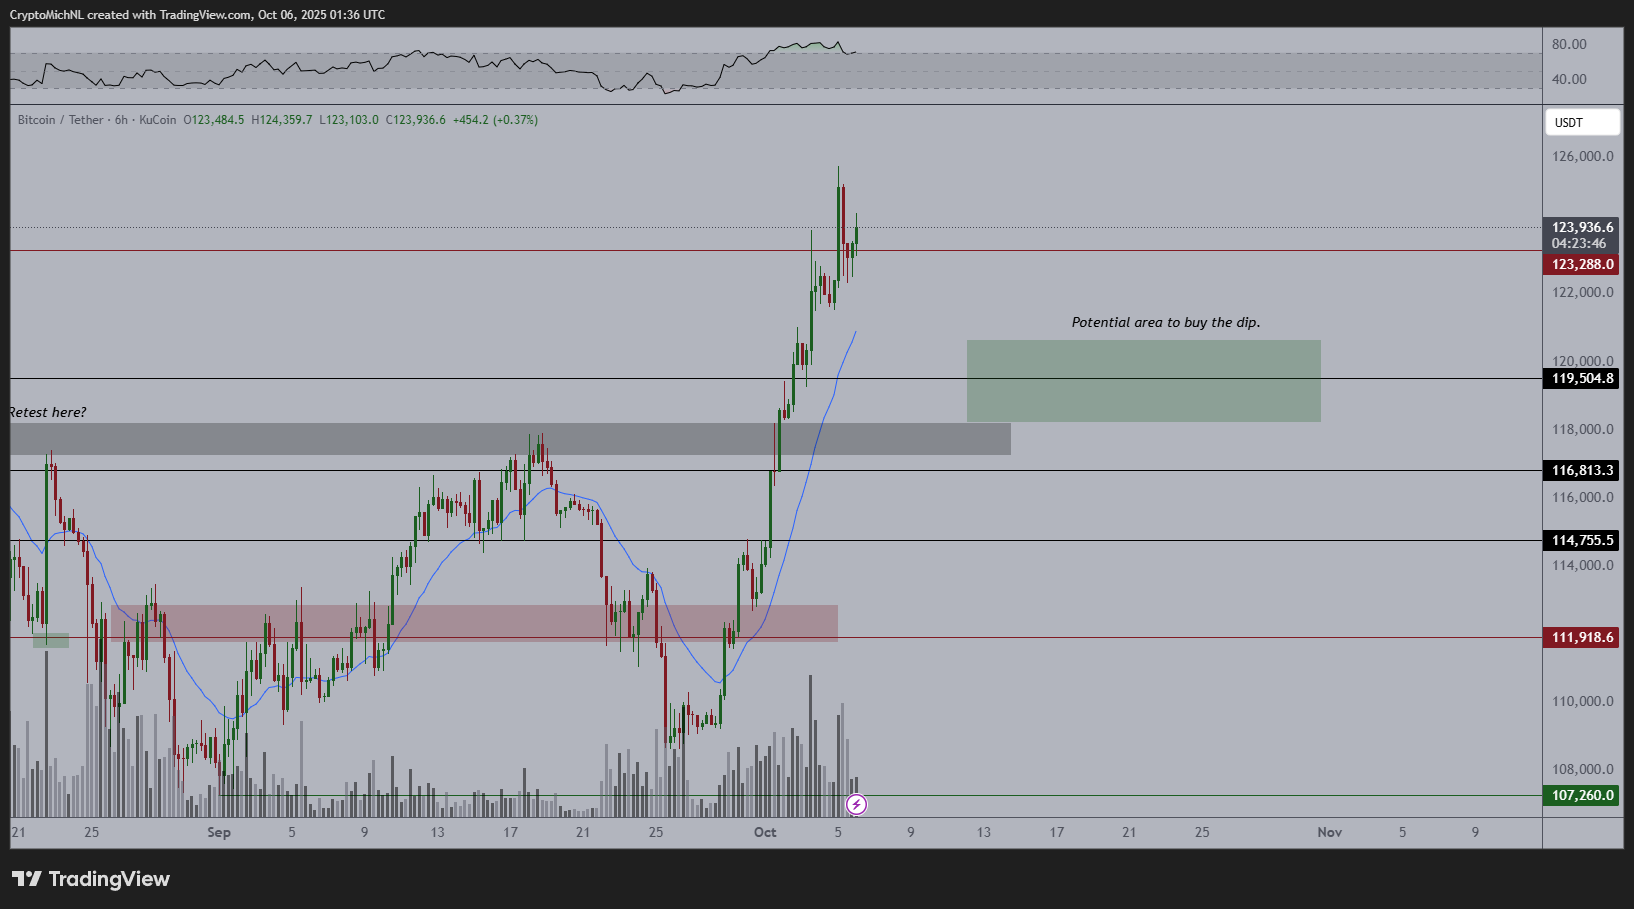
At the time when this was written, the exponential moving (EMA) 50-period on 4-hour timeframes, at $119.250, and rapidly rising, is one of them.
“For the week ahead, I think we could see a 4h50EMA retest – it’s overextended and you can see the retests in previous similar Price Action,” trader CrypNuevo wrote in an X thread on Sunday.
“After that, we should see a new move up higher. Therefore, I’m still favoring longs over shorts from the 4h50EMA.”

An accompanying chart highlighted the results of interaction with the EMA since the start of May.
Rekt, the trader and analyst, claimed that it would be unreasonable to expect the cryptocurrency price to jump into new territory before establishing initial support at its top.
“There’s should be no surprise that Bitcoin has rejected from ~$124k on the first time of asking in this uptrend. After all, the last time Bitcoin rejected from $124k, the rejection preceded a -13% pullback,” he told X followers over the weekend.
“Bitcoin needs to prove this $124k resistance is a weakening point of rejection. And any shallower dip or pullback from here would do just that.”

Rekt Capital suggested that a 4% dip to meet a rising trend line at around $118,000 would mean that Bitcoin would “still be positioned for additional upside later on.”
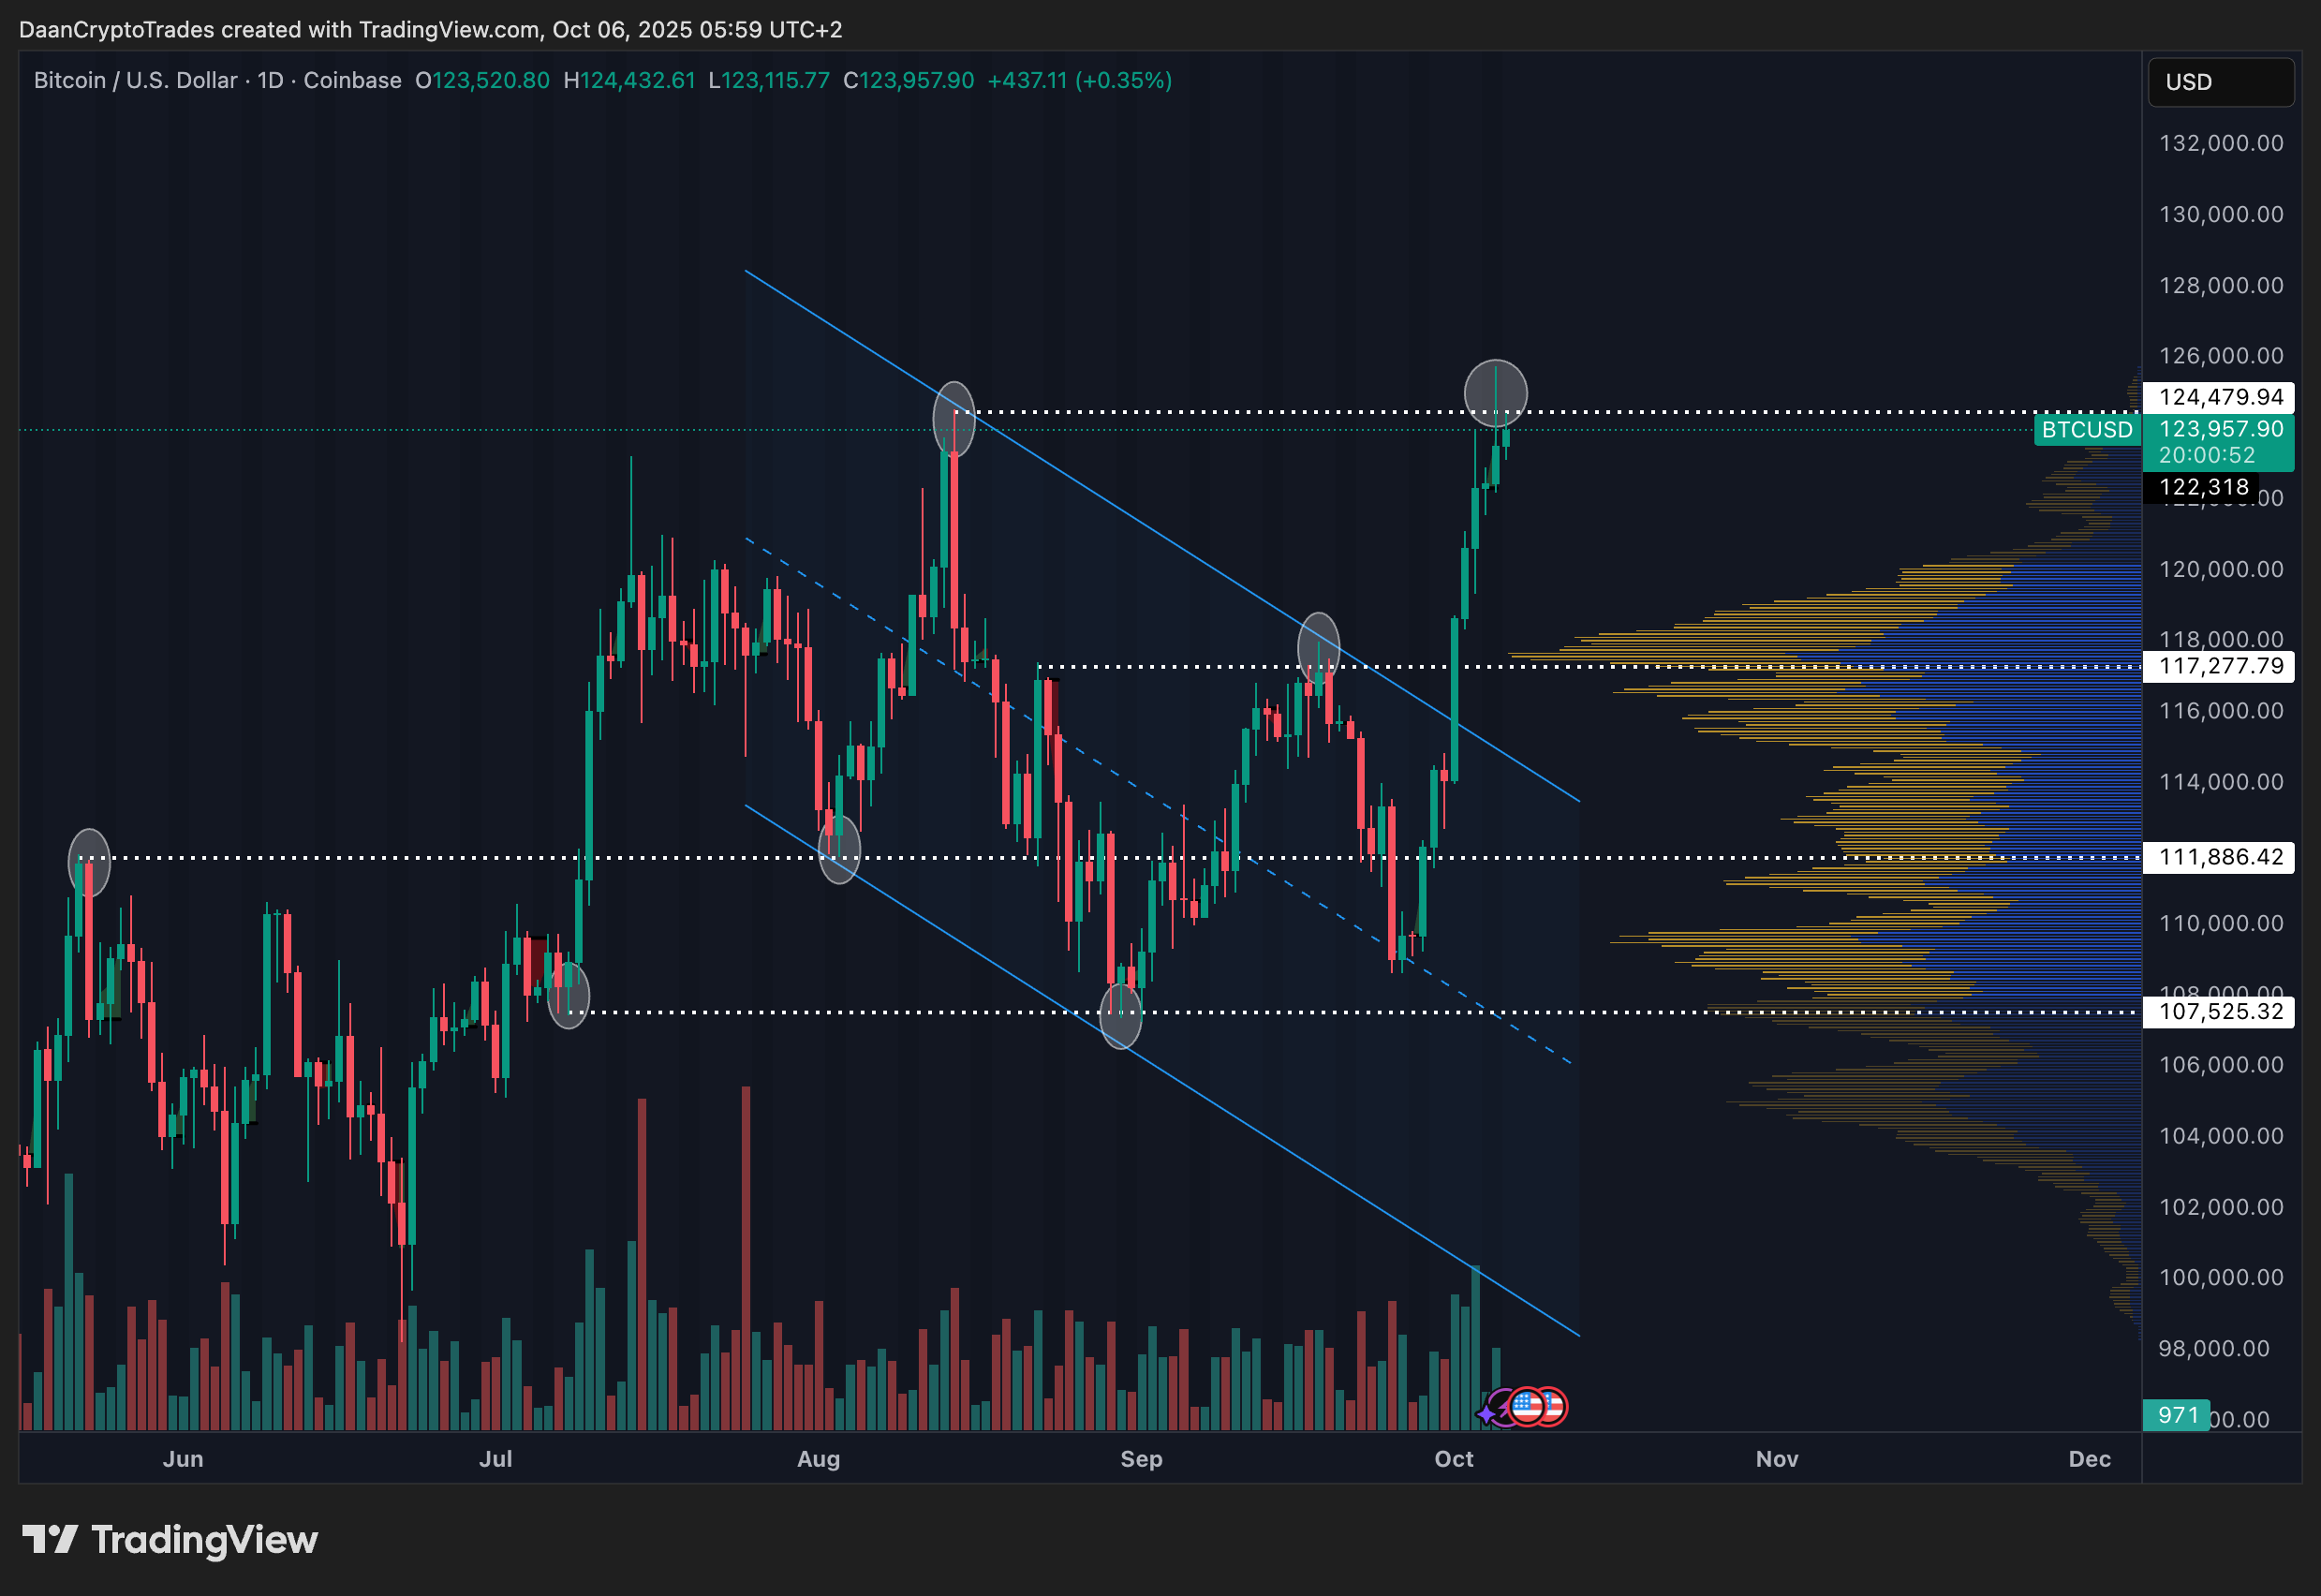
“I would not want to see price lose that $117K-$118K again. This was roughly the mid range and a very high volume area,” Daan Crypto Trades, said in his X update on Monday.
“Overall structure looks good, just needs to maintain higher highs and higher lows from here on out. If this starts ranging again between $112K-$124K that would not be great for the larger view I think.”
AI says no more Bitcoin “Uptober”
Amid increasing excitement over the crypto bull run’s next innings, a new style of prediction tool may disappoint those hoping for swift gains.
In one of its “Quicktake” blog posts on Monday, onchain analytics platform CryptoQuant raised questions over how “Uptober” may shape up.
“After a significant uptrend, the price has entered a consolidation phase between the key support at 108,000 and the resistance at 123,000,” contributor CryptoOnchain summarized.
“This price action on the technical chart shows signs of a ‘re-accumulation’ period, during which large market players may be accumulating their positions for the next major move.”
BTC/USD surprised us with a record-breaking high on the weekend. But despite the surprise, we still risk not reaching our expectations for the rest of this month.
CryptoQuant believes that AI provides the evidence. Its proprietary forecasting tool, NBeats Ensemble, which gathers data from nearly 400 “onchain features,” now says that the odds of an October BTC price breakout are “low.”
“The model’s prediction is for continued fluctuations within the current range. However, there is a subtle yet important nuance in this forecast: the model expects these fluctuations to occur primarily in the upper half of the range,” the post said.
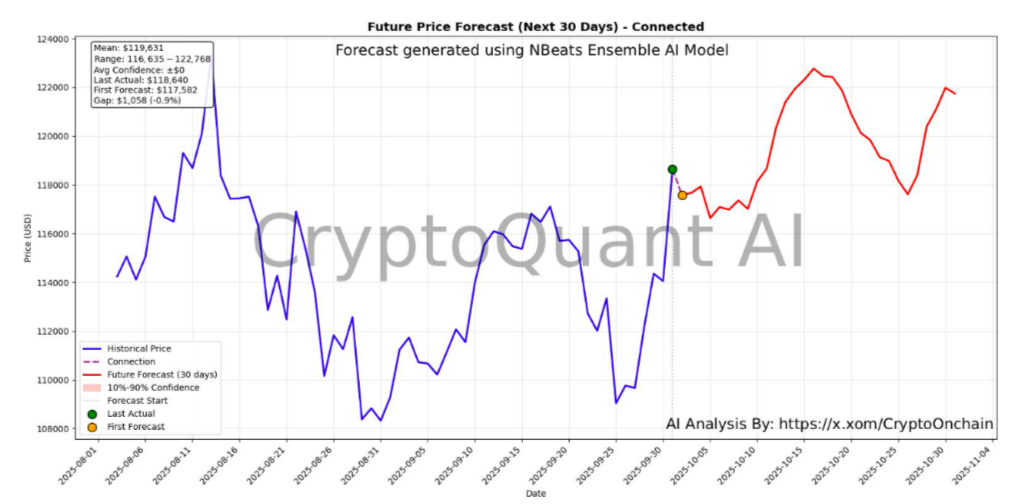
Bitcoin should thus spend multiple weeks preparing a resistance breakout, which will flip $123,000 from resistance to support. The hodlers need to be patient.
“By combining technical analysis with the AI model’s forecast, the most probable scenario for October 2025 is the continuation of Bitcoin’s neutral, range-bound movement,” CryptoQuant is over.
“Traders should closely monitor the support level at 108,000 and the resistance at 123,000, as a decisive break of either level could define the next mid-term directional move.”
Fed officials to speak as shutdown halts data
The ongoing US government shutdown adds to the list of delayed macroeconomic data this week.
This makes for a fascinating round of Federal Reserve senior officials who are scheduled to appear on stage in the next few days.
Jerome Powell will be delivering pre-recorded remarks to the Community Bank Conference, in Washington. Michelle Bowman is scheduled to make two separate appearances.
Powell has long been under pressure from US President Donald Trump to quicken interest-rate cuts, something the Fed only voted to commence last month after holding rates steady throughout 2025.
The absence of data, notably pertaining to the weakening labor market, creates friction. The Fed’s next rate decision is about three weeks away.
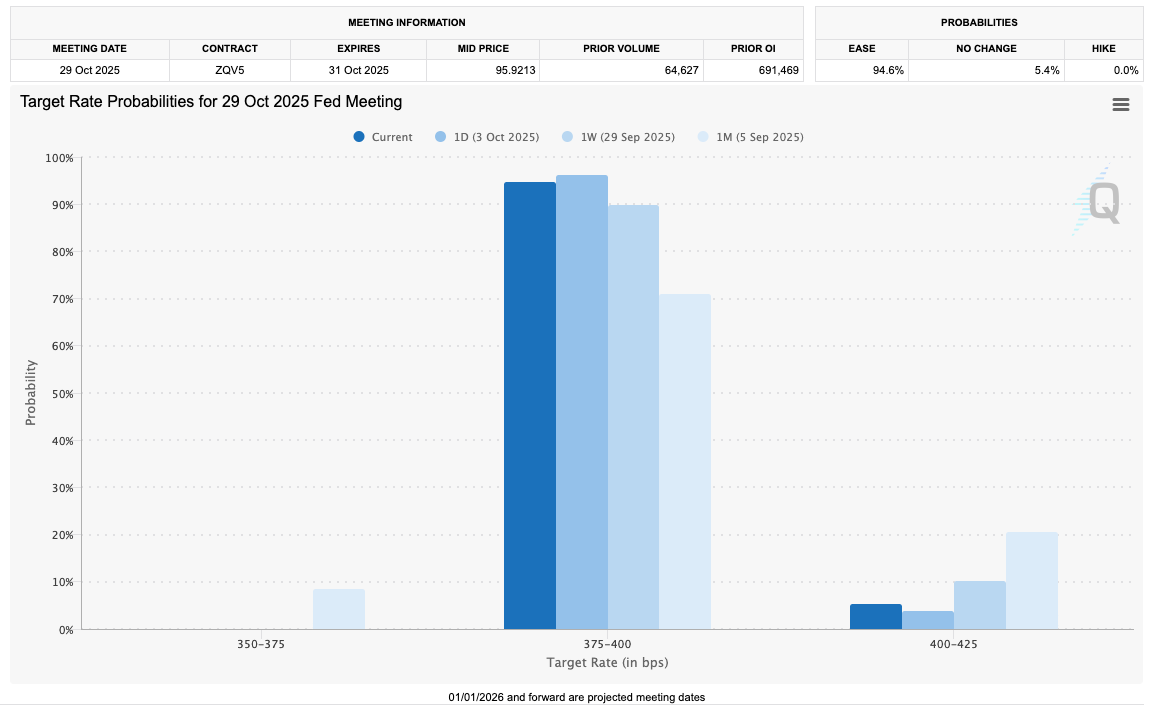
“The markets are looking ahead to the October and December Fed meetings amid the shutdown,” trading resource The Kobeissi Letter summarized in an X thread.
Tailwinds still exist for crypto-asset and risk assets bulls. The shutdown, sources argue, is likely to remain a “non-event” for the markets, and with six months of straight gains for US stocks, there is increasingly little reason to doubt the uptrend.
“The stock market continues climbing the ‘wall of worry,’ trading resource Mosaic Asset Company wrote in the latest edition of its regular newsletter, “The Market Mosaic.”
“Despite concerns over the health of the labor market and economic impact of the government shutdown, the S&P 500 is hovering near record highs and has spent 108 consecutive days trading above its 50-day moving average.”
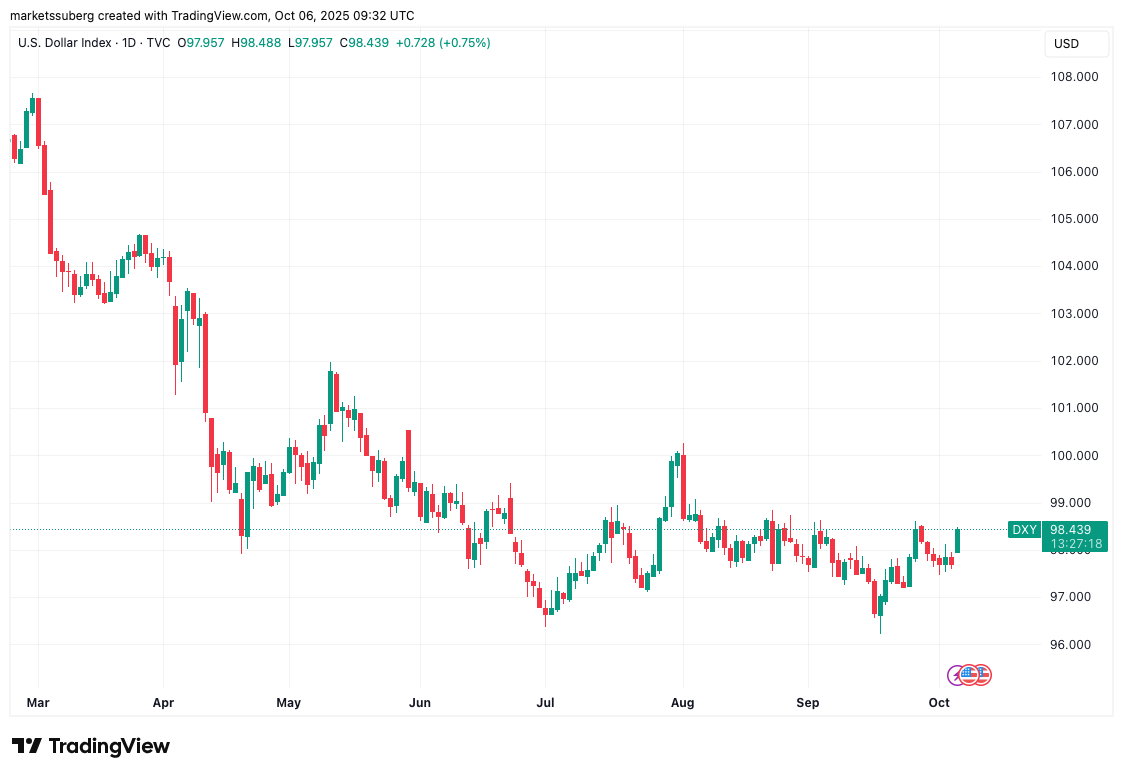
Among the risks to the strength of the risk-on rally, Mosaic highlighted a possible rebound in US dollar strength, as indicated by the US Dollar Index (DXY).
The index has struggled with a rebound after hitting 96.22 in mid-September — its lowest level since February 2022.
Greedy, but not too greedy?
In just 10 days, crypto market sentiment has flipped on its head — but traders have kept their cool at all-time highs.
Related: Bitcoin may move ‘very quick’ to $150K, altseason doubts: Hodler’s Digest, Sept. 28 – Oct. 4
The latest readings from the Crypto Fear & Greed Index show that while “greed” now dominates, excessive emotions have not yet entered the market.
On Sunday, the Index hit local highs of 74/100, stopping short of its “extreme greed” zone to drop back to 71/100 to start the week.
Those levels still represent a threefold increase versus lows of 26/100 seen on Sept. 26.
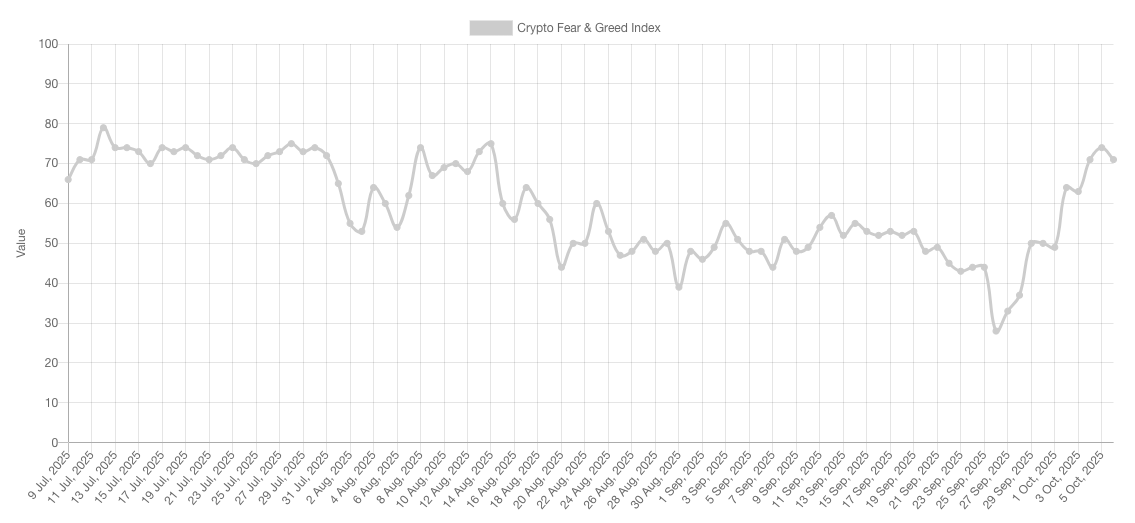
Bitcoin’s previous all-time high in mid-August, for reference, delivered peak Fear & Greed Index readings of 75/100, with the trip to $125,700 thus narrowly forming a divergence with price.
Elsewhere, another sentiment measure, this time from crypto analytics platform Alphractal, closely tracked the late September lows and subsequent rebound.
This is the most accurate sentiment analysis metric in the crypto market that I know.
The Fear and Greed Index generates some noise, but this one is the pure alpha of the sentiment from analysts who set the tops and bottoms of Bitcoin😆Chart: @Alphractal https://t.co/slClE3mj1T pic.twitter.com/oFr9kzv4UM
— Joao Wedson (@joao_wedson) October 3, 2025
This article does not contain investment advice or recommendations. Risk is inherent in every investment decision. Before making a choice, readers are advised to do thorough research.
“This article is not financial advice.”
“Always do your own research before making any type of investment.”
“ItsDailyCrypto is not responsible for any activities you perform outside ItsDailyCrypto.”
Source: cointelegraph.com


