


Bitcoin (BTC), in order to cope with its rising supply on exchanges and ETFs, requires a new spot demand. Local selling pressure was created by recent exchange outflows and ETF inflows, which amounted to nearly 34,000 BTC. Data on derivatives showed that the most recent recovery is primarily driven by short-covering.
Bitcoin researcher Axel Adler Jr. said BTC trading and the exchange-traded funds (ETFs) continue to indicate a supply imbalance, despite this latest recovery. Weekly exchange netflows increased by approximately 18,000 BTC. This means that more coins have been added to the exchanges. Increased BTC inflows will increase near-term sales.
Bitcoin Weekly Exchange Netflows Source: CryptoQuant
The ETFs that track spot BTC also saw net outflows in the region of 16,000 BTC over the same period. Adler claimed that the institutional flow failed to absorb the exchange supplies and reinforced the recent risk off phase in the market.
Both metrics led to a sell-off of around 34,000 BTC across all exchanges and ETFs. Adler pointed out that BTC’s exchange netflows will likely have to move back into neutral or even negative territory in order for the price recovery to gain more momentum.
Glassnode Analyst Cryptovizart noted The daily ETF trade volume is now below $20 billion. This was above $50 billion at the end of 2025. The lower trading volume is a sign of waning speculative activity through traditional financial channels, and weakened spot absorption at rallies.
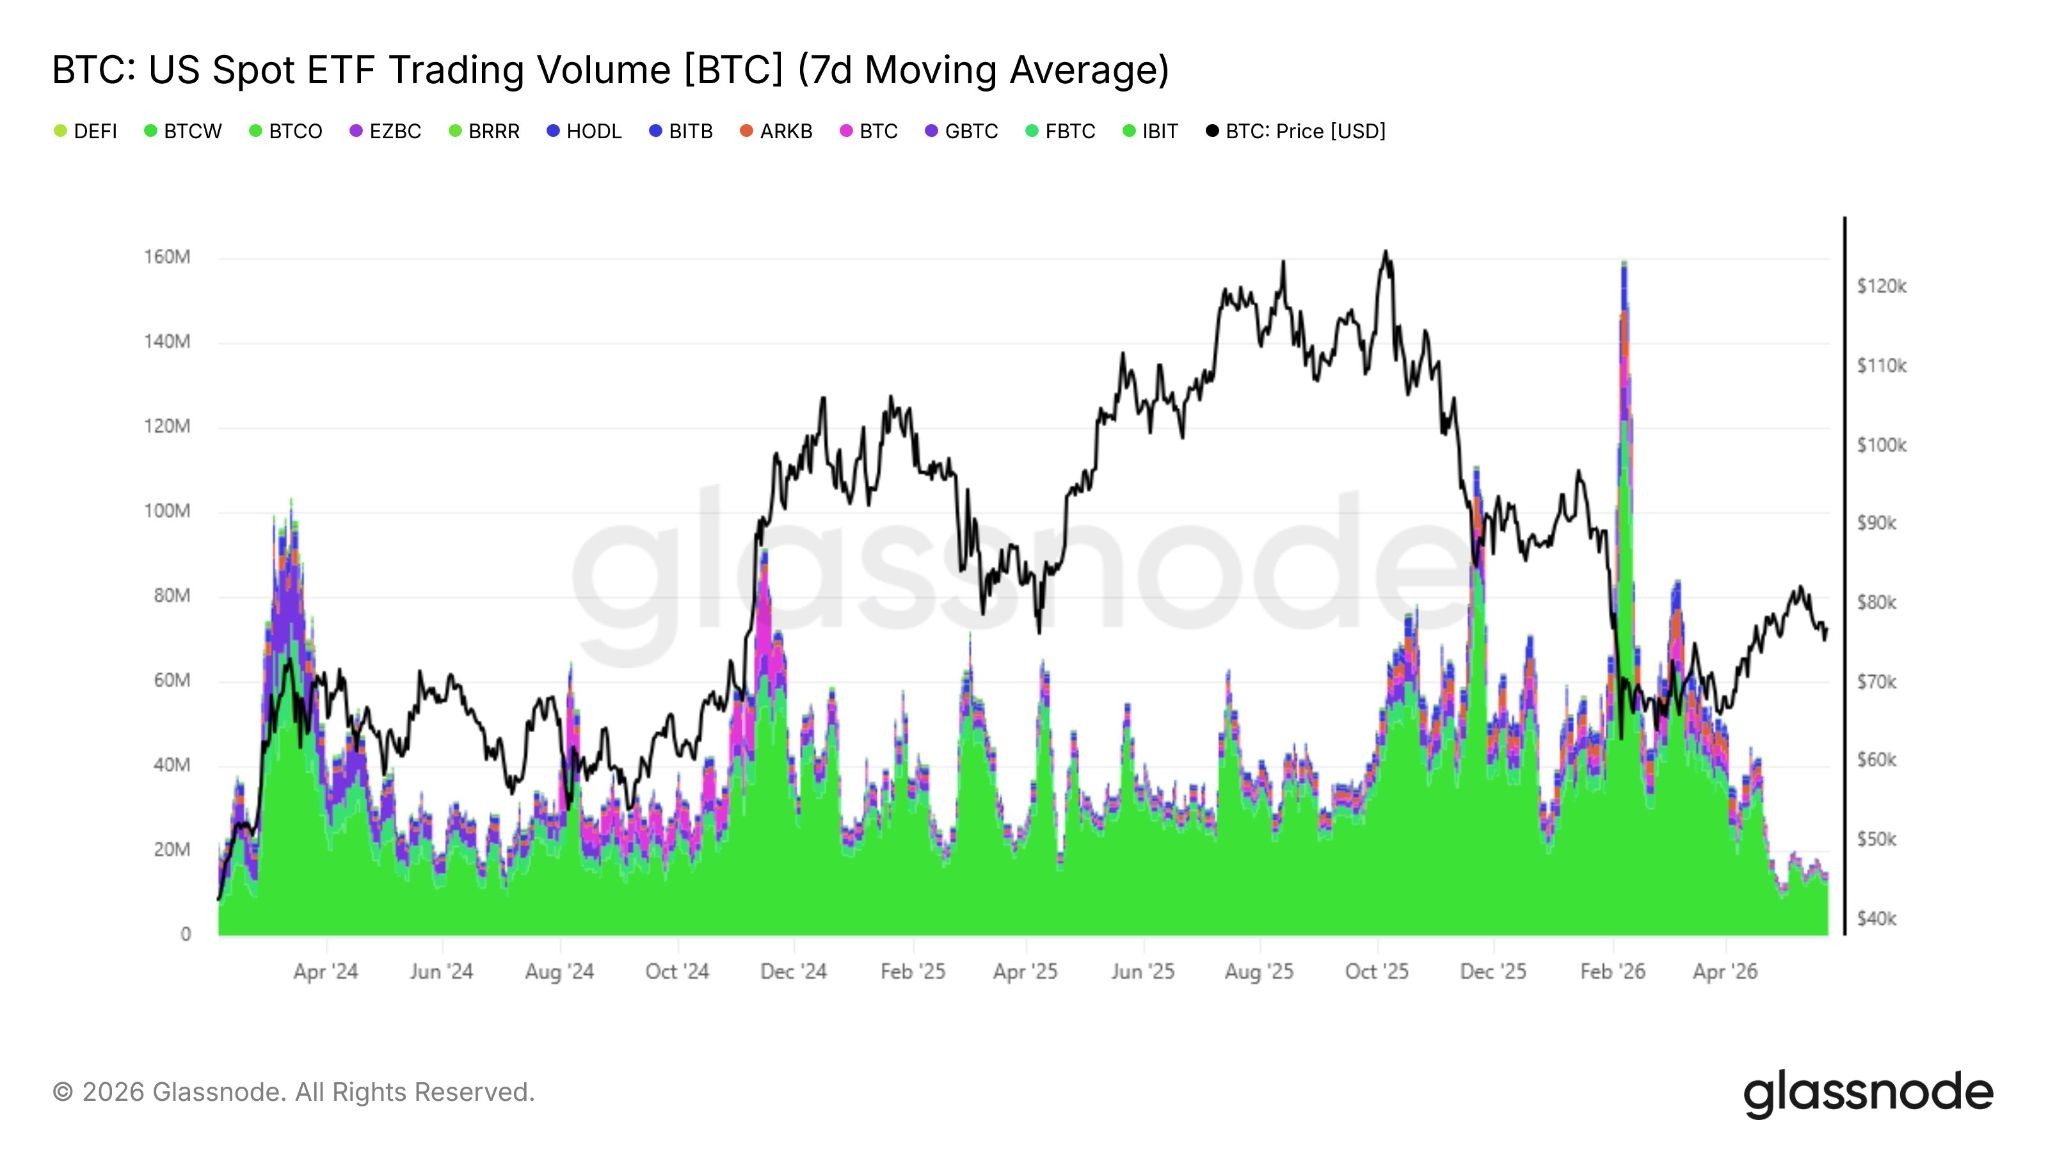
Spot BTC ETF trading volume. Source: Glassnode
Bitcoin Open Interest Reset eases Pressure
After a short dip under the support level of $75,000, buyers quickly recovered lost ground. Reports of an upcoming US-Iran agreement reduced investor concerns about the market and elevated appetite for risk assets.
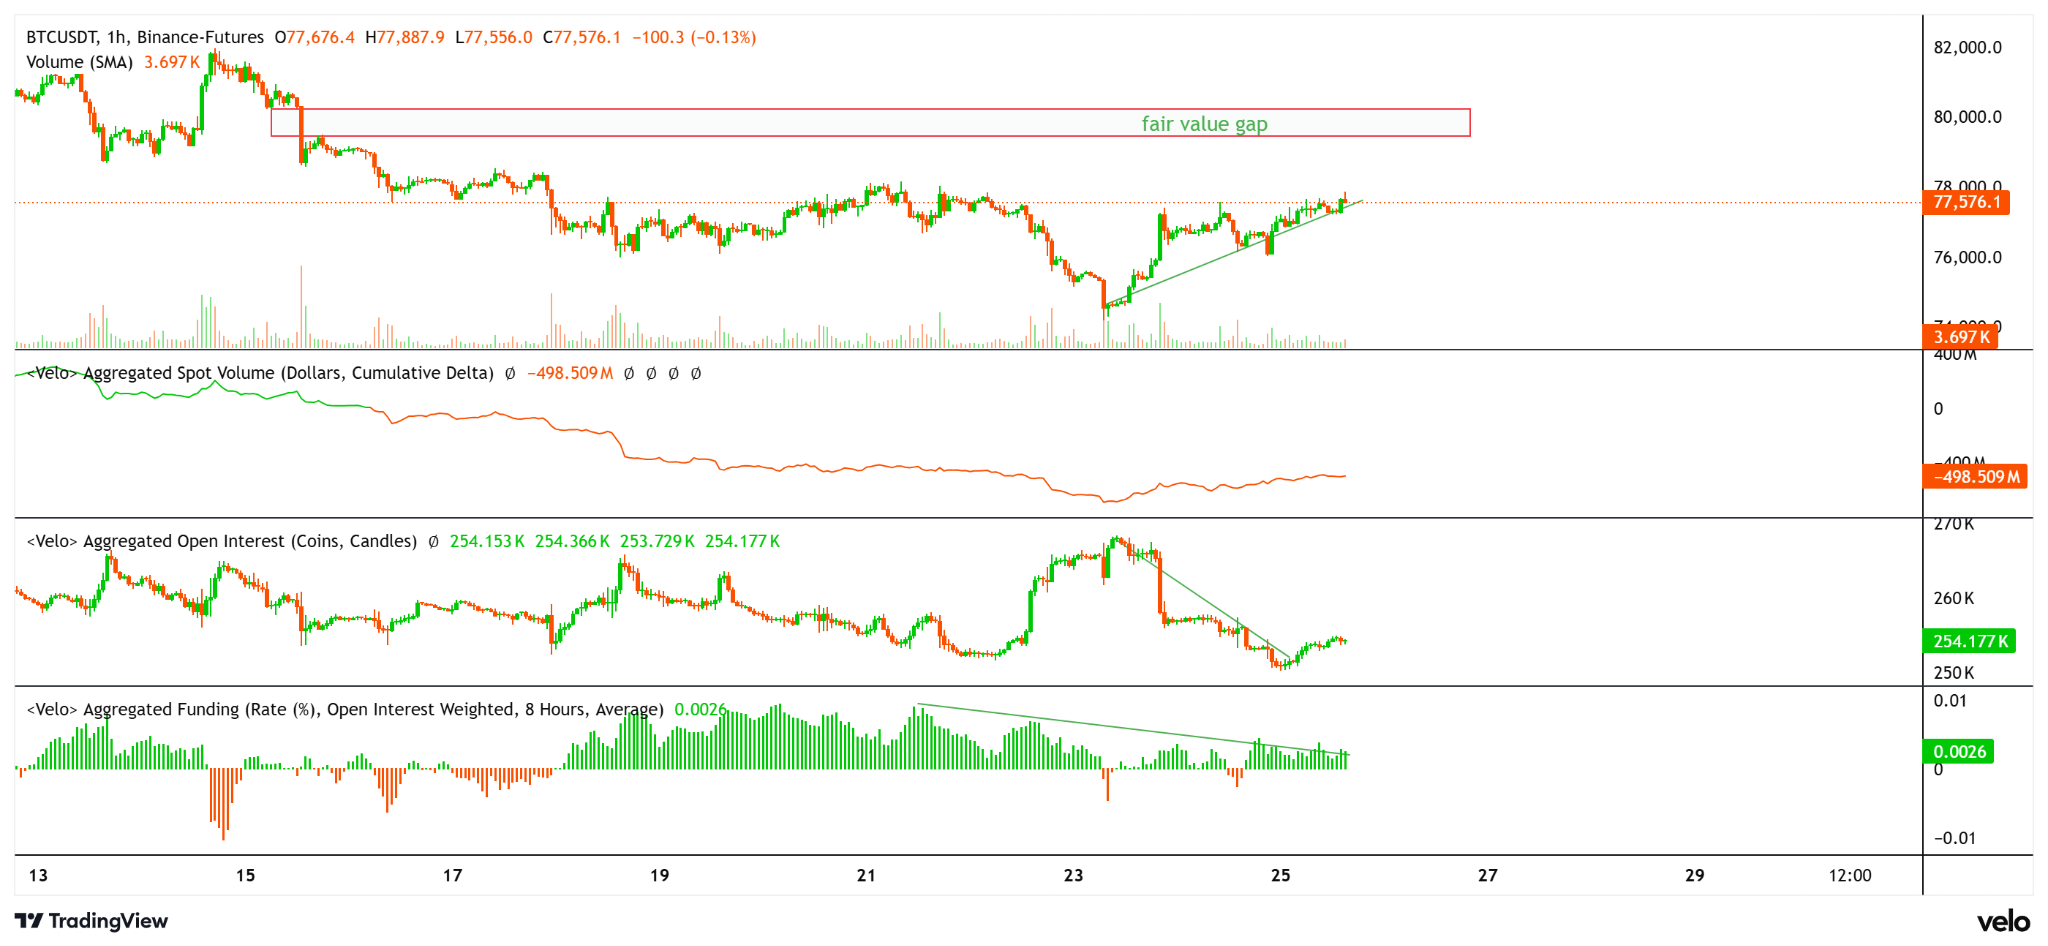
Source: BTC rate, CVD spot price, open interest and funding rate. Source: Velo chart
The derivatives data revealed that the rise was driven largely by traders who closed their positions. The aggregated Bitcoin open interest dropped to 250,000 BTC, from almost 268,000 BTC in the recovery phase. It then rose slightly to 254,000 BTC by Monday. This decline was due to traders covering shorts after BTC gained support.
The aggregate funding rate also dropped during this upward movement, from the recent highs of 0.008 to a level around 0.0026 while remaining in positive territory. This reset reduced the risk of a long-squeeze and demonstrated that long leveraged positions were less crowded.
Crypto analyst Rei Researcher noted The daily funding rate is negative and has been since February 2026. This indicates that long traders are still paying short traders to maintain positions. Analyst added that Bitcoin’s ability to remain stable near $77,500 in spite of persistent pressure points on short timeframes suggests steady demand for spot is absorption supply at higher timeframes.
Glassnode information also indicated signs of cooling sales pressure. Price momentum decreased by 21,7% in the fall, while cumulative volume deltas (CVDs) for futures and spot were both lower. climbed By 77.2%, and by 35.5% respectively. It was evident that sales activity had slowed down, as the positioning of the market became more even.
Open interest and spot demands must rise along with the price for BTC to reach $80,000.
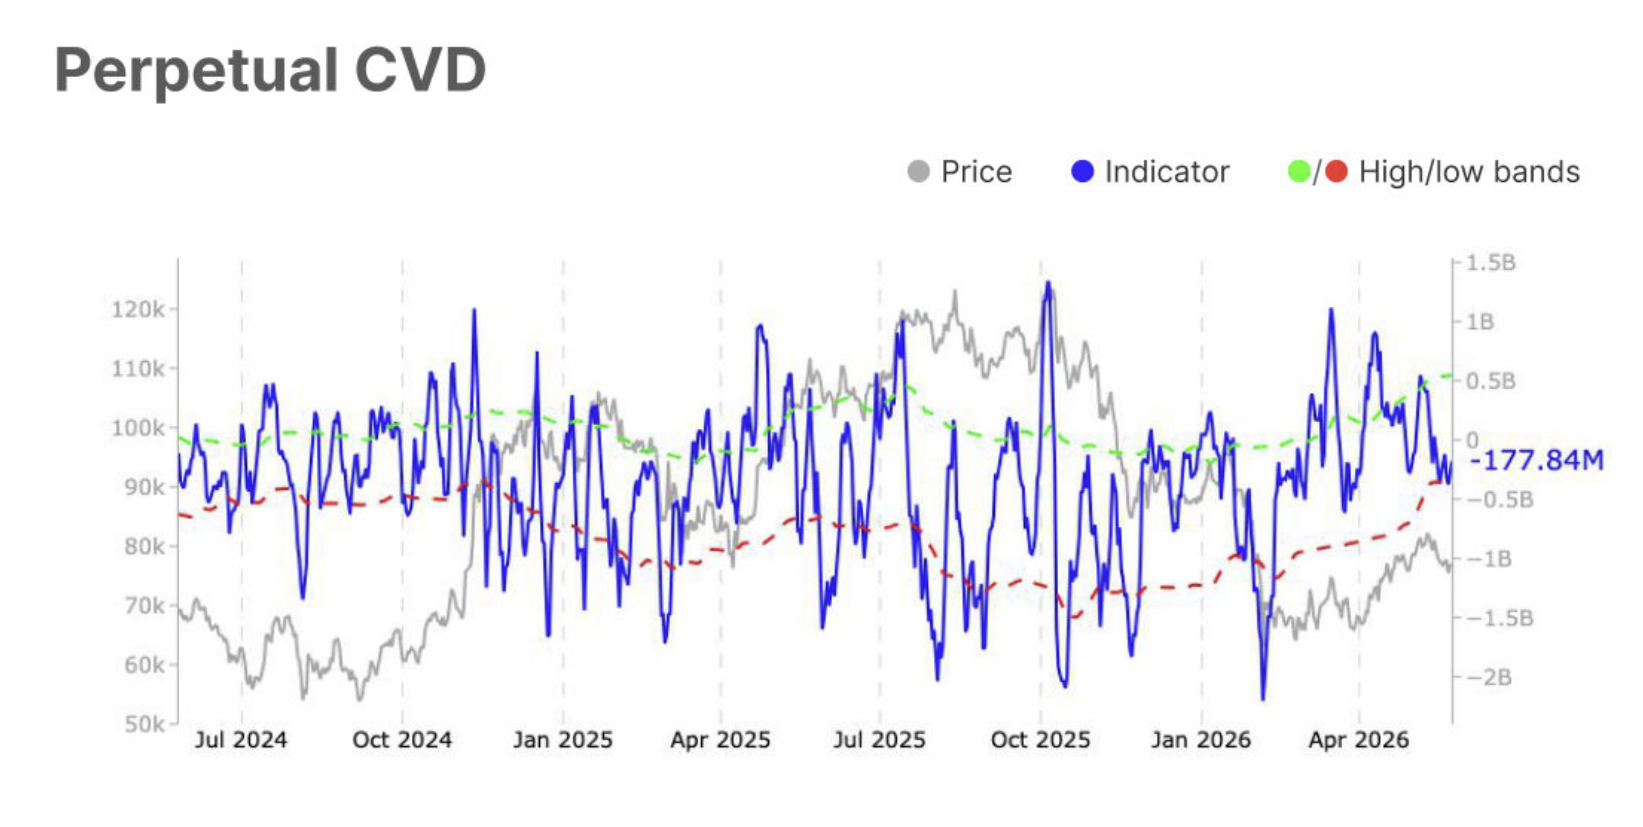
BTC permanant CVD data. Glassnode Source
Related: Bitcoin risks drop to $72K as demand metric hits 2026 lows
“This article is not financial advice.”
“Always do your own research before making any type of investment.”
“ItsDailyCrypto is not responsible for any activities you perform outside ItsDailyCrypto.”
Source: cointelegraph.com


