


Bitcoin was thrown back into volatility by a slight pullback, which ended two weeks of consolidation at a level just under its record-high of $123,000. Price briefly dropped near $115,000 but is already recovering, indicating that the bullish momentum continues despite recent sales pressure. The market participants seem to be calm, as strong demand absorbs the drop quickly.
Read More Related Content
CryptoQuant has released new data that shows today’s movement in price coincides with the significant rise of open interest at major exchanges. Binance, Bybit and Gate have all seen sharp increases in their open interest over the past 24 hours. This suggests that traders are moving aggressively. Notably, the exchanges listed above were recipients of significant Bitcoin transfers during the early part of the day. This was likely due to the activity by institutional investors or whales.
A shift in the market’s mood is suggested by this alignment between price recovery and increasing open interest. The short-term market is regaining momentum, and bulls seem ready to defend the key levels. Bitcoin will be determined by its ability to regain recent support or continue on a range bound path as volatility increases. Coming days may be crucial for Bitcoin’s next phase. price action.
A rise in open interest is a sign of increasing volatility
According to Julio Moreno’s, CryptoQuant’s head researcher, during the last 24 hour, open interest surged by approximately $4 billion, indicating that leveraged positions—particularly shorts—have entered the market in large numbers. The spike in Bitcoin transactions coincided with the large transfers of Bitcoin to exchanges such as Binance and Bybit. These major exchanges received a significant portion of today’s high-volume Bitcoin transactions.
This suggests increased speculation as traders expect further movement in prices. Coins flooding exchanges along with a rising interest in the market are typically indicators of upcoming volatility. Short sellers seem to be betting against further downside. However, Bitcoin is already recovering after its recent $115,000 drop, and this could result in a short squeeze, if the momentum swings back to favor bulls.
Ethereum and altcoins have shown notable strength. Ethereum has outperformed Bitcoin since May. The performance is attributed to the institutional accumulation in the US and increased regulatory clarity. Investors are closely watching ETH’s altcoin rally to determine if capital is still being transferred from BTC into other altcoins.
Related Reading
Bitcoin Holds Key Support After Minor Pullback
BTC’s daily chart shows a bullish pattern despite the recent volatility. After briefly consolidating near the $122,000 resistance zone and reaching an all-time high just above that level, the price retraced toward the $115,700–$117,000 support band. This area, defined by the yellow horizontal range, aligns with the SMA 50 day simple, at $117.593.23, confirming its position as an important technical support.
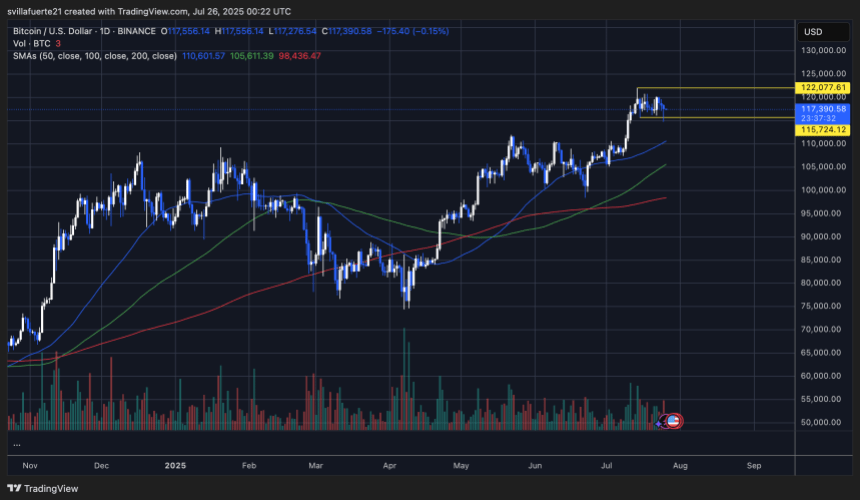
On the chart, we can clearly see that there is a clear uptrend. The higher highs remain intact and so do lower ones. BTC is trading well above its 100-day SMAs (green), and 200-day SMAs (red), which are at $112 547.95, and $10 9436.38 respectively. These levels act as support zones for a stronger market if the selling pressure is intensified.
There is no panic, even though volume on the red candle has risen slightly. BTC will remain in the bulls’ favor as long as it remains above $115.700. Breakouts above $122,000 could signal the continuation of a trend and open up new heights.
Chart by TradingView. Image courtesy of Dall-E.
“This article is not financial advice.”
“Always do your own research before making any type of investment.”
“ItsDailyCrypto is not responsible for any activities you perform outside ItsDailyCrypto.”
Source: www.newsbtc.com


